3He(e,e'd) Analysis
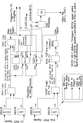
HRS-L trigger plot
Is it OK?
01.) 
New approach to data analysis
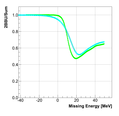
I have decided to try a bit different approach for calculation of
the asymmetries. This time I summed the Pmiss histograms directly
and weighted the final results with the mean value of the
target polarization and beam polarization. Earlier I
calculated the weighted asymmetry for each run separately and
then calculated the mean value of the asymmetry for all the runs.
To my opinion is this new approach more transperent, although
it is not that precise (regarding the target polarization).
02.) 
03.) 
04.)  05.)
05.) 
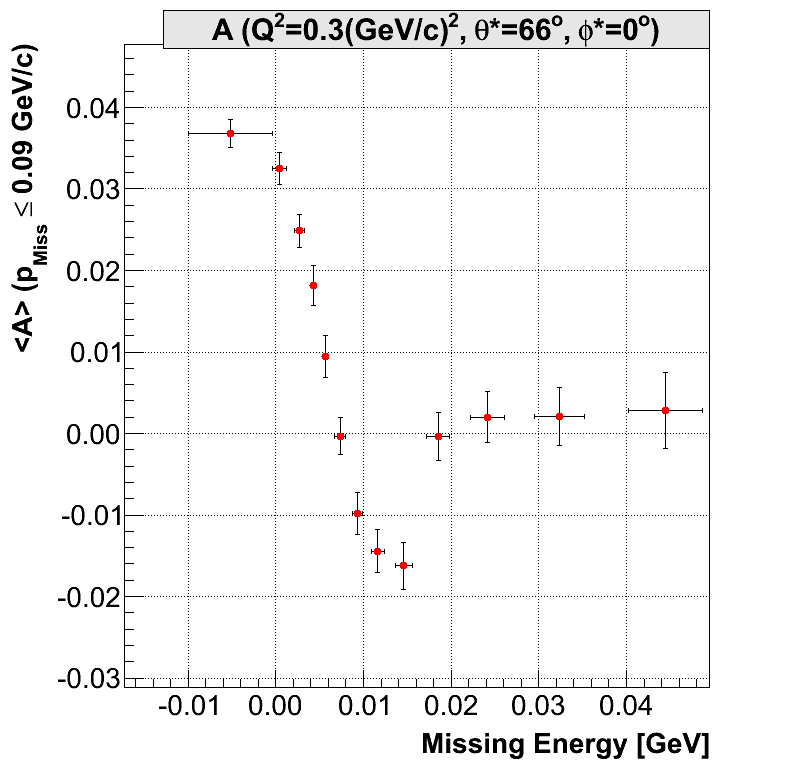
The results (pmiss = 0 analysis) of my new approach are very similar to the
results of mu previous analysis.
06.) 
Next plots show how results change with considered cut on Pmiss:
07.)  08.)
08.) 
Mainz Results for (e,e'p):
Achenbach et al. EPJ (2008)
I would like to compare my results with these measurements. We are both having
very similar kinematics conditions. I need to run MCEEP simulation
to estimate the 2BBU contribution inside the 3BBU.
09.)  10.)
10.) 
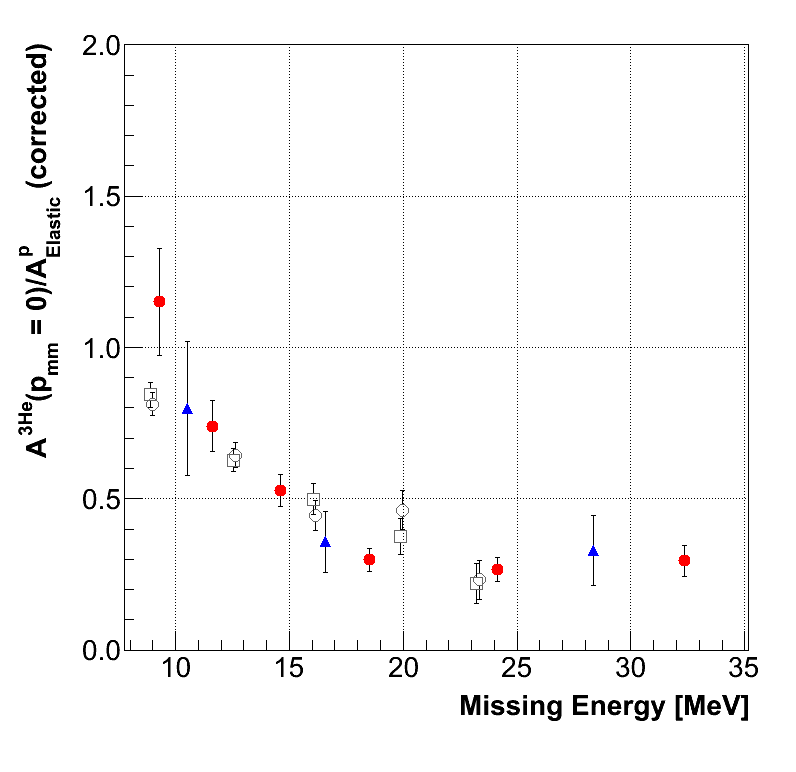
Results of the comparison of our results with MAINZ data:
My results:
11.) 
Gray points are MAINZ data
Blue squares = Transverse 14.5 deg data
Red circles = Longitudinal 14.5 deg data
Cyan triangles = Longitudinal 12.5 deg data
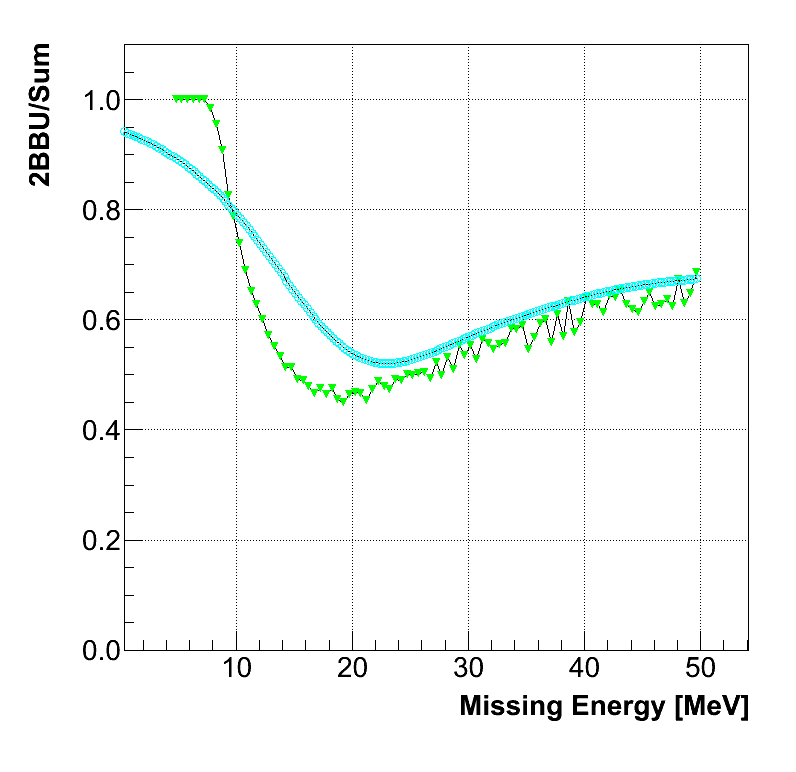
The results of the comparison depend strongly on which simulation
results we consider. This is still work in progress.
Simulation convoluted with Gauss(A=1, MX=-1,Sigma = 4.5 )
12.) 
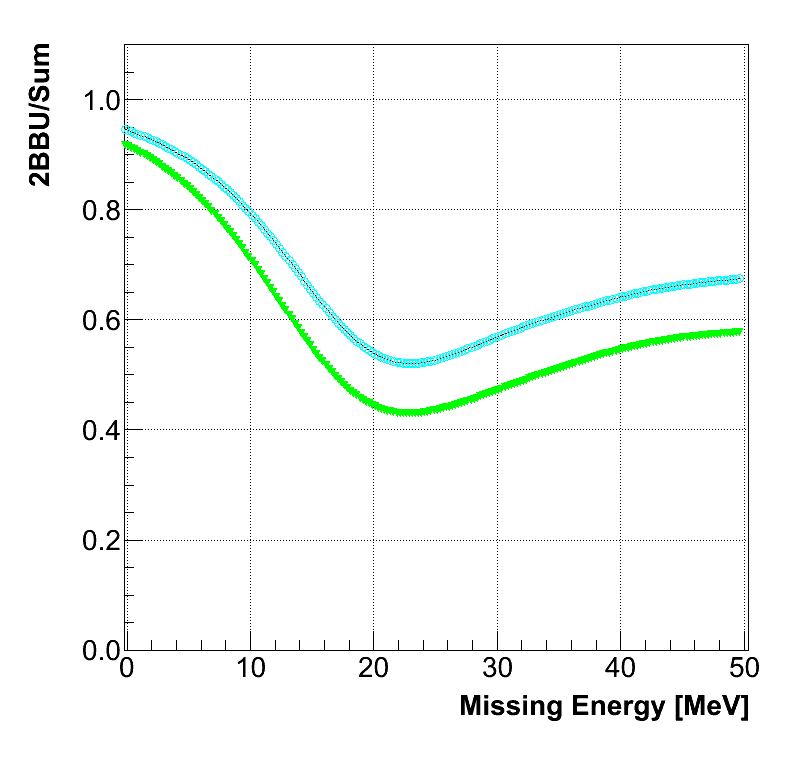
Simulation without convolution:
13.)  14.)
14.) 
Simulation convoluted with Gauss(A=1, MX=-1,Sigma = 4.5) AND 30% more 3BBU
15.)  16.)
16.) 
Simulation convoluted with Gauss(A=1, MX=-0.8,Sigma = 2.5)
17.)  18.)
18.) 
Last modified: 02/01/12


 05.)
05.) 
 08.)
08.) 
 10.)
10.) 


 14.)
14.) 
 16.)
16.) 
 18.)
18.) 