3He(e,e'd) FALSE Asymmetries
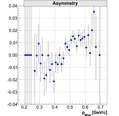
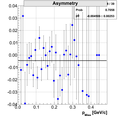
Asymmetry as function of pBB:
(14.5, -75)deg and (14.5, 82)deg result:
01.)  02.)
02.) 
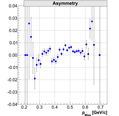
Old (12.5, -75)deg result:
Strange behavior at small pBB is caused by the ZLIB errors in
the analysis. When using unzipped data, problem dissatisfy.
03.) 
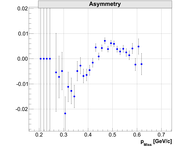
New (12.5, -75)deg result (results with new rootfiles):
04.) 
Asymmetry as function of pMiss (results with new rootfiles):
Problem with ZLIB has not affected much the results at low pmiss.
However without this problem, we have better statistics, because
more runs can be used in the analysis.
05.) 
False Asymmetry Calculation with 1.5sigma cuts on windows:
There is much less statistics in the glass windows than we expected. I believe
this is caused by the coincidence and other cuts. If run has 350k good events,
only approx 50k come from windows.
06.) 
False asymmetry for (14.5, -75)deg data, HWP- In, Out:
We observe non-zero asymmetry in the events coming from the windows.
07.)  08.)
08.) 
False Asymmetry with cut only on left side of the left window (upstream):
I used more restrict cuts to completely get rid of the Helium. Asymmetry remains.
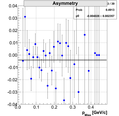
False asymmetry for Longitudinal (14.5, -75)deg data, HWP- In, Out:
09.)  10.)
10.) 
11.) 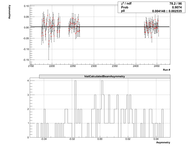 12.)
12.) 
False asymmetry for Longitudinal (12.5, -75)deg data, HWP- In, Out:
13.)  14.)
14.) 
15.)  16.)
16.) 
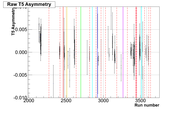
False Asymmetry check using unpolarized calibration run scaler asymmetries:
Checked if any false asymmetry can be observed in the scaler data for unpolarized
calibration data. I realized I do not have enough statistic to say anything conclusive
about that.
17.) 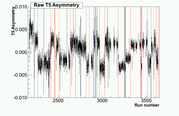 18.)
18.) 
Where does mean asymmetry flip sign?
I checked if any of my cuts causes the false asymmetry. I realized that we get
change in the asymmetry sign (from mean production value of +0.005 to false
asymmetry -0.005) when we perform a ReactPoint cut.
19.) 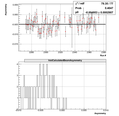 ... 1st (No cuts)
20.) 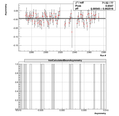 ... 2nd (All secondary cuts)
21.)  ... 3rd (All cuts + PID)
22.) 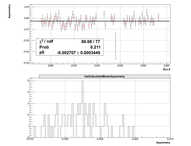 ... 4th (Only Coincidence time cuts)
23.)  ... 5th (HRSL target cut)
24.)  ... 6th (HRSL+BB target cut)
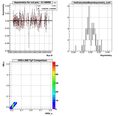
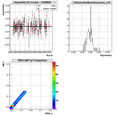
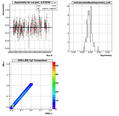
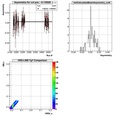
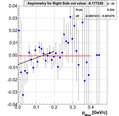
"Running" one side ReactPt cut:
Simon suggested to do a cut on fare side of the left target window (20sigma) and then slowly start to narrow
the cut to see, how the asymmetry changes when we leave more and more helium out. In the
end at 0sigma only glass in left window remains.
Mean Asymmetry for Longitudinal (14.5, -75)deg data, HWP-In:
25.) 
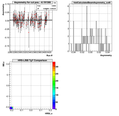





Mean Asymmetry for Longitudinal (14.5, -75)deg data, HWP-Out:
26.) 



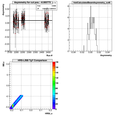
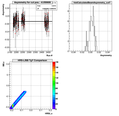

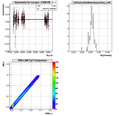
Slope and offset analysis for Longitudinal (14.5, -75)deg data, HWP-In:
27.) 

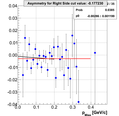


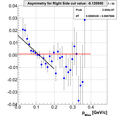
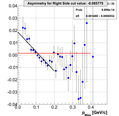


Slope and offset analysis for Longitudinal (14.5, -75)deg data, HWP-Out:
28.) 



Last modified: 10/19/11
 02.)
02.) 


 08.)
08.) 
 10.)
10.) 
 12.)
12.) 
 14.)
14.) 
 16.)
16.) 
 18.)
18.) 
 ... 1st (No cuts)
 ... 2nd (All secondary cuts)
 ... 3rd (All cuts + PID)
  ... 4th (Only Coincidence time cuts)
  ... 5th (HRSL target cut)
 ... 6th (HRSL+BB target cut)


