Measurements with the Lupolen target
Here is the description of the first tests with
the Lupolen target, that we did on 25.2.2016 and 26.2.2106,
together with the first online results.
The idea of this test was to see if plastic (Lupolen) target could replace the LH2
target and be used for measuring proton charge form-factor with the
initial-stat-radiation. Since plastic comes as a thin target, it offers a
possibility to measure the cross-section without problems with the events
coming from the walls and from the support frame of the LH2 target, which
was one of the limiting factors of the last ISR experiment. On the other hand,
the carbon, due to its large cross-section, contributes much more to the total
detection rate than the hydrogen. This means, that carbon part needs to be
subtracted very carefully in order to reach the wanted Hydrogen spectrum.
To data-taking was very similar to the original ISR experiment. The cross-section
was first measured for the elastic setting and then also for different lower momenta,
in order to record the radiative tail. For each momentum setting the data were collected
first with the Lupolen target and then also with the Carbon target, to allow most
precise subtraction of the background.
In the first night the data were collected at 195MeV with spectrometers A and C, where
the later one was kept at the constant setting and was considered as a luminosity
monitor. In the second night the data were collected at 450MeV, where A was used
as a luminosity monitor and B was employed to record the radiative tail. Both
times the data were collected at Q**2 ~ 0.02 GeV**2.
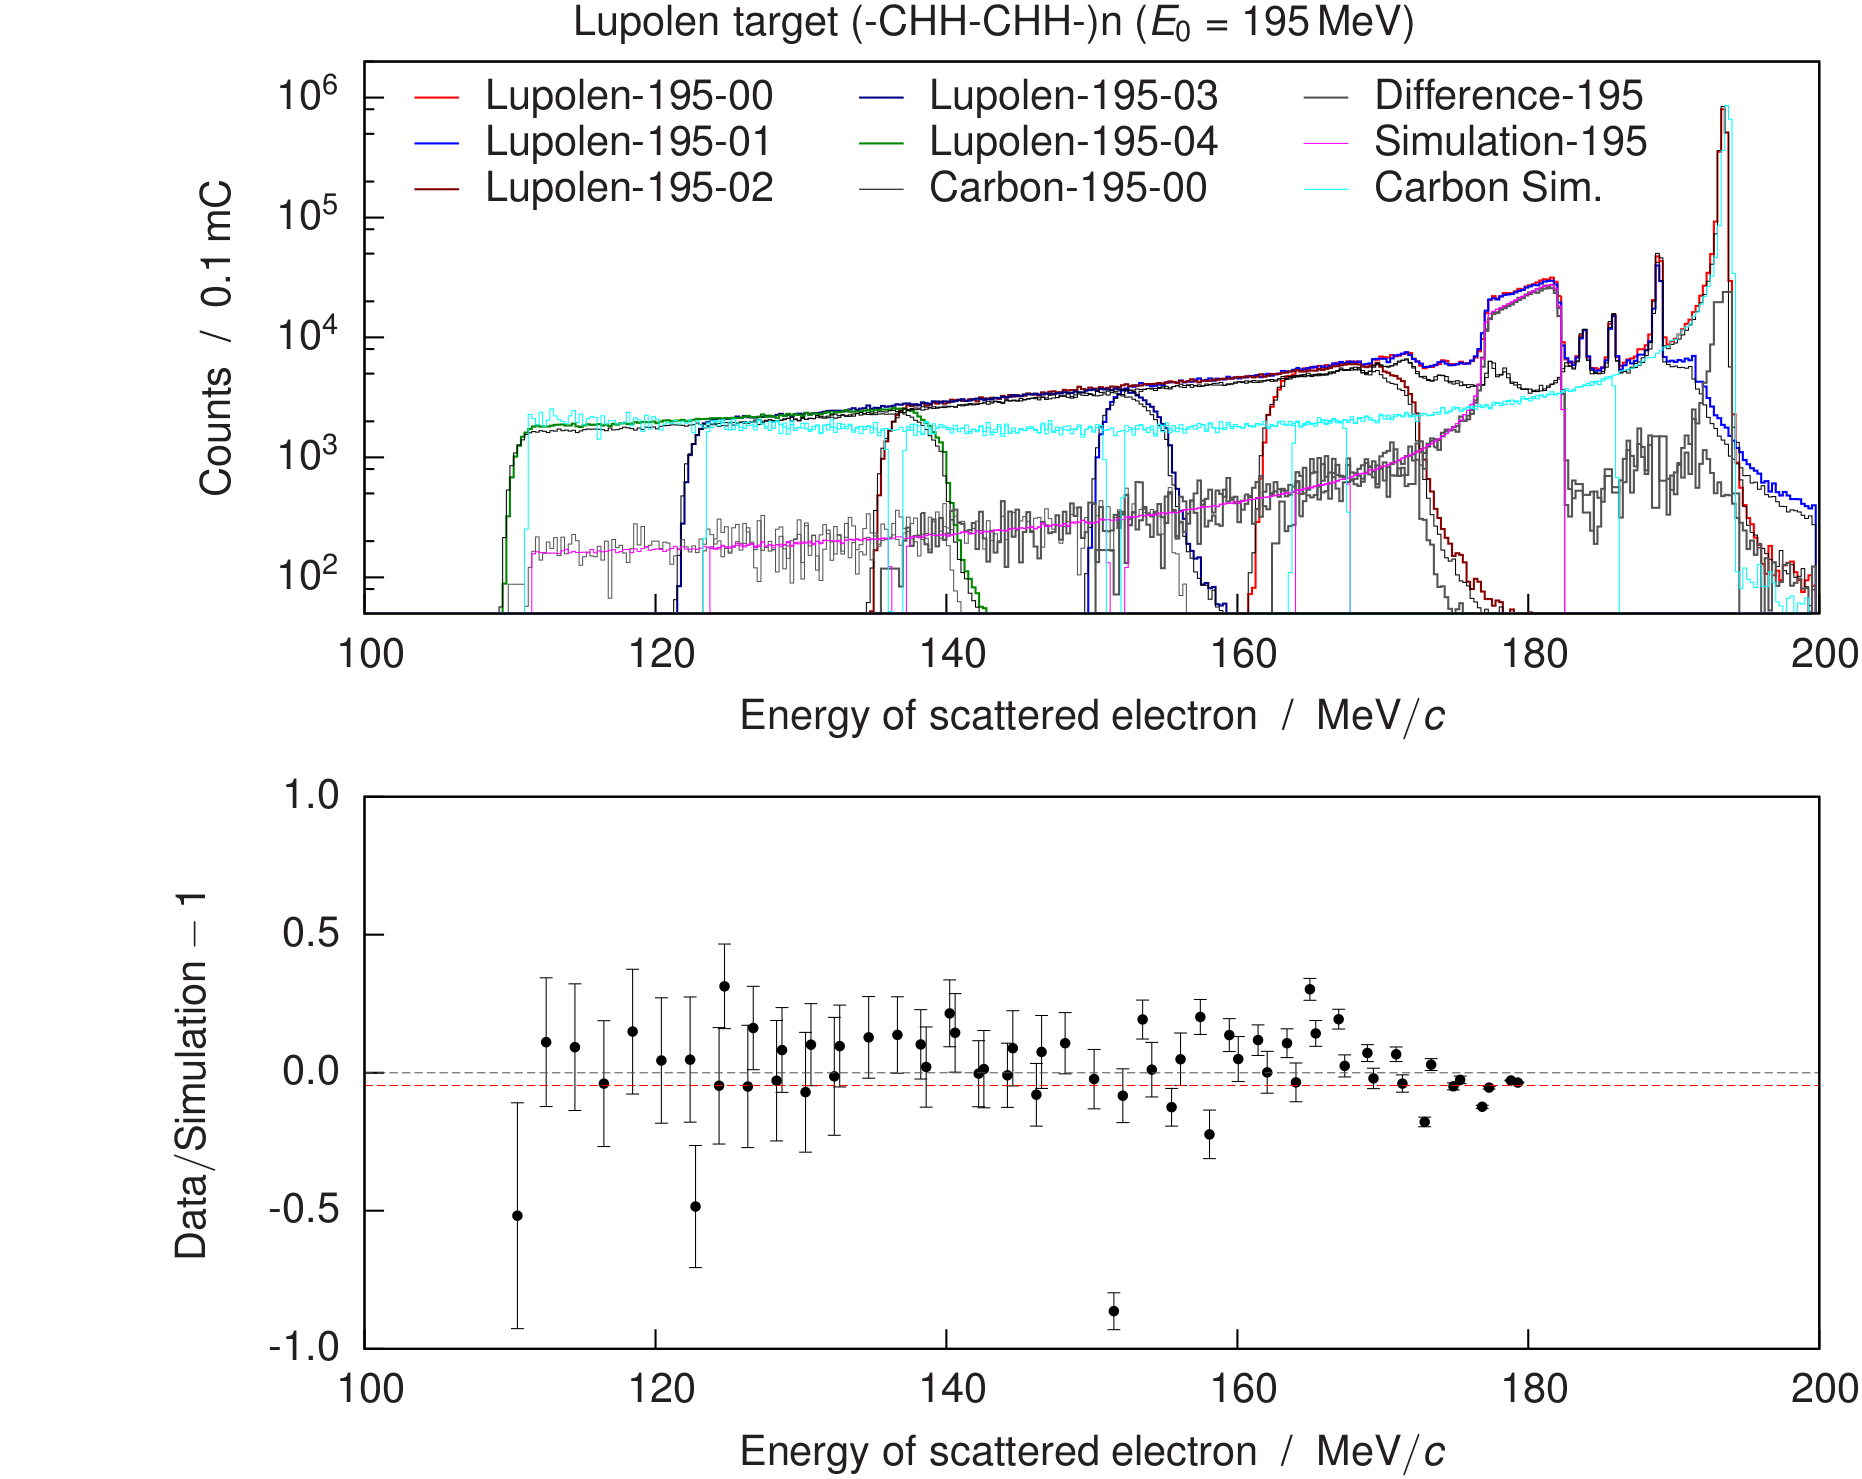
The first online results of the test are shown on figures “LupolenResults195MeV.pdf”
and “LupolenResults450MeV.pdf”. The colourful lines represent the Lupolen data,
while the black lines very close by show the carbon data normalised to the size of the
carbon elastic peak in the Lupolen. The gray line shows the difference between
the two measured spectra or the extracted hydrogen data. The magenta line shows the
full hydrogen simulation, while the cyan line shows the simulation for the carbon.
Results @ 195MeV with Spec-A* and Spec-C:
Results @ 450MeV with Spec-A and Spec-B*:
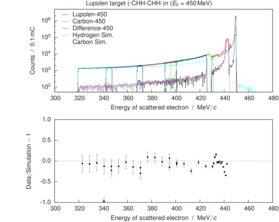
The points on the second plot show the relative difference between the extracted
hydrogen data and the corresponding simulation. Here one can see, that we get
a reasonably good agreement between the two. The agreement is much better than
I expected, but the statistics of the data is unfortunately too poor to be able to say
definitely how precise can we reconstruct the hydrogen tail. However, the data
clearly show, that most of the rate indeed comes from the carbon, as expected.
Hydrogen contributes only approx. 10% of the total rate, which means, that for
a precise measurement luminosity needs to be determined very, very precisely.
Additionally, systematics needs to be under very good control. Already a precent
error in the luminosity measurement, results in a huge shift in the hydrogen
data/simulation spectrum. This is not encouraging and disfavours the use of the
Lupolen target for the precise measurement of the Hydrogen Form-Factors.
From the attached plots one can also see that in the investigated region the carbon
simulation is not working well, mostly because it lacks the contributions from the
excited states. The present simulations uses only a simple Form-factor (homogeneous
sphere with a diffuse surface) and radiative corrections in a peaking approximation.
In summary: I believe that the test was successful and shows that we can reasonably
well extract hydrogen data from the data with plastic target. This might come in handy,
when measuring near the elastic line. However, when far away from the elastic line,
the contribution of the hydrogen is very small, which makes such measurement
very sensitive to even smallest systematic uncertainties.
Last modified on 04.03.2016