Determination of the pivot points of the three spectrometers
Introduction:
An information important for the analysis of measured data is the
information about the pivot points of the spectrometers. To determine
these points for the spectrometer setup of the A1 collaboration, we
did the following measurement:
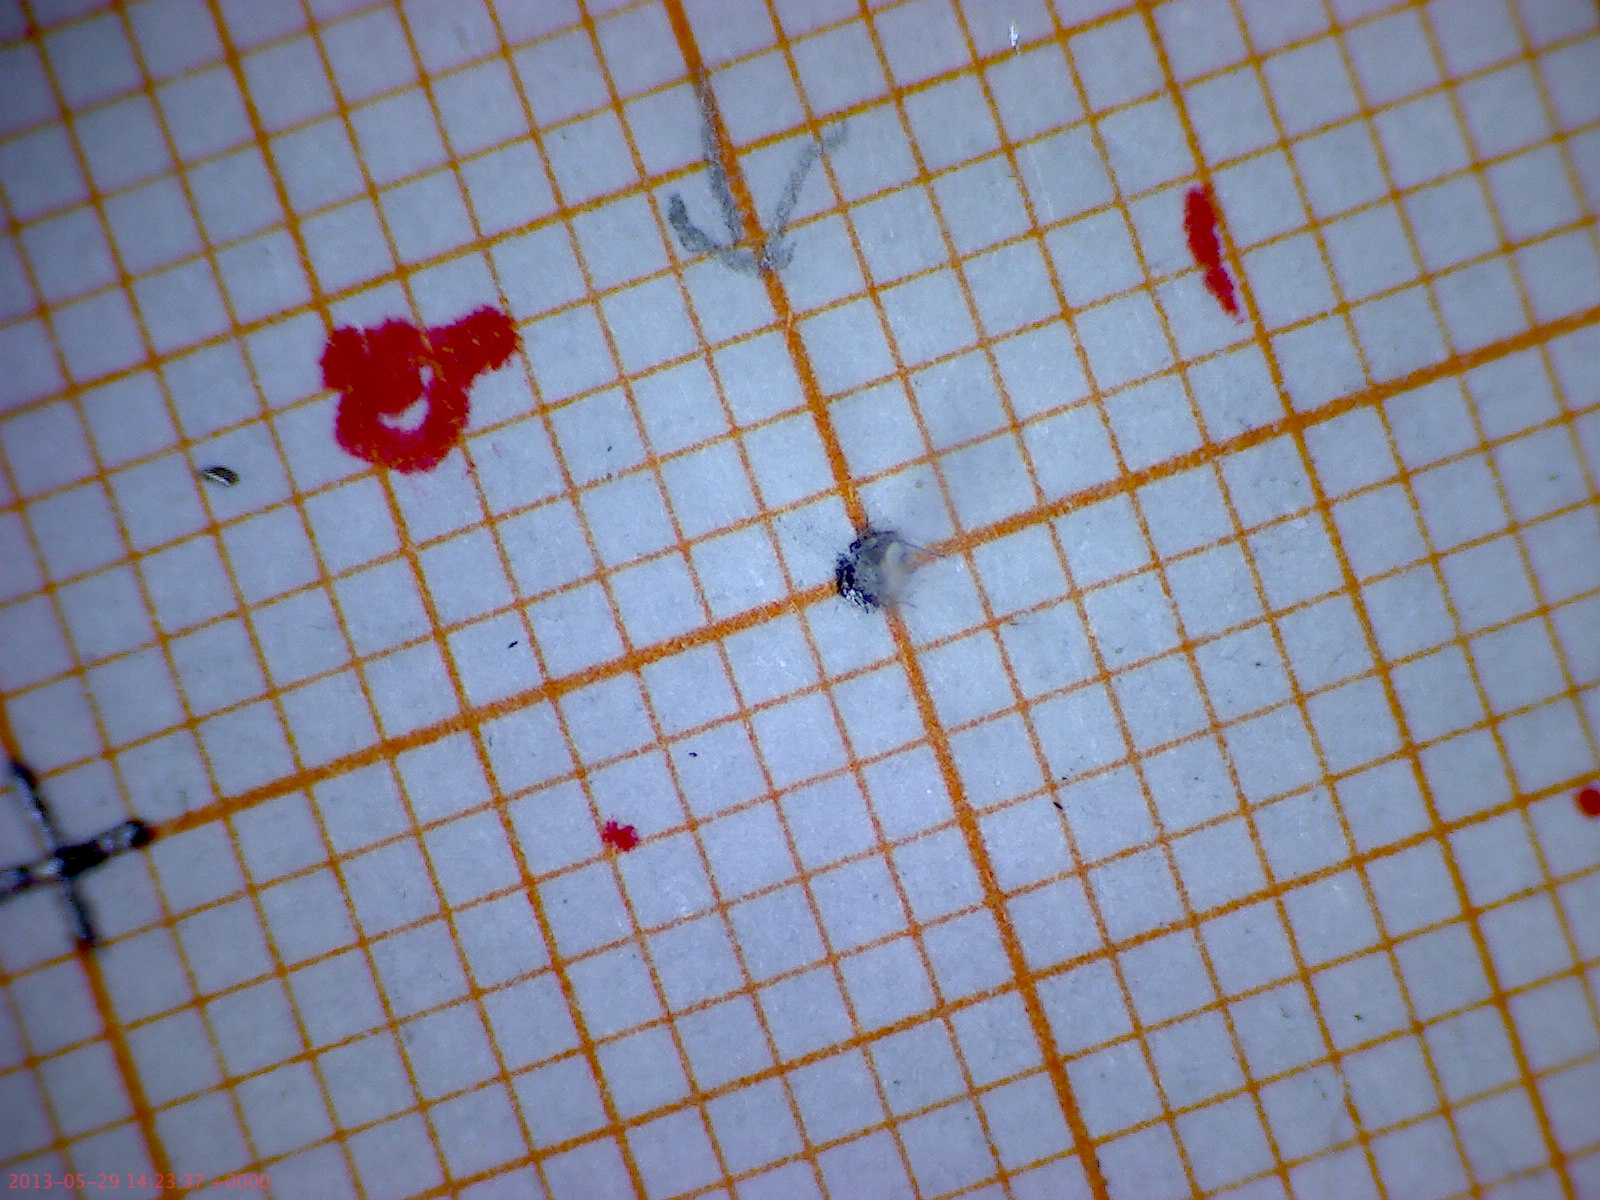
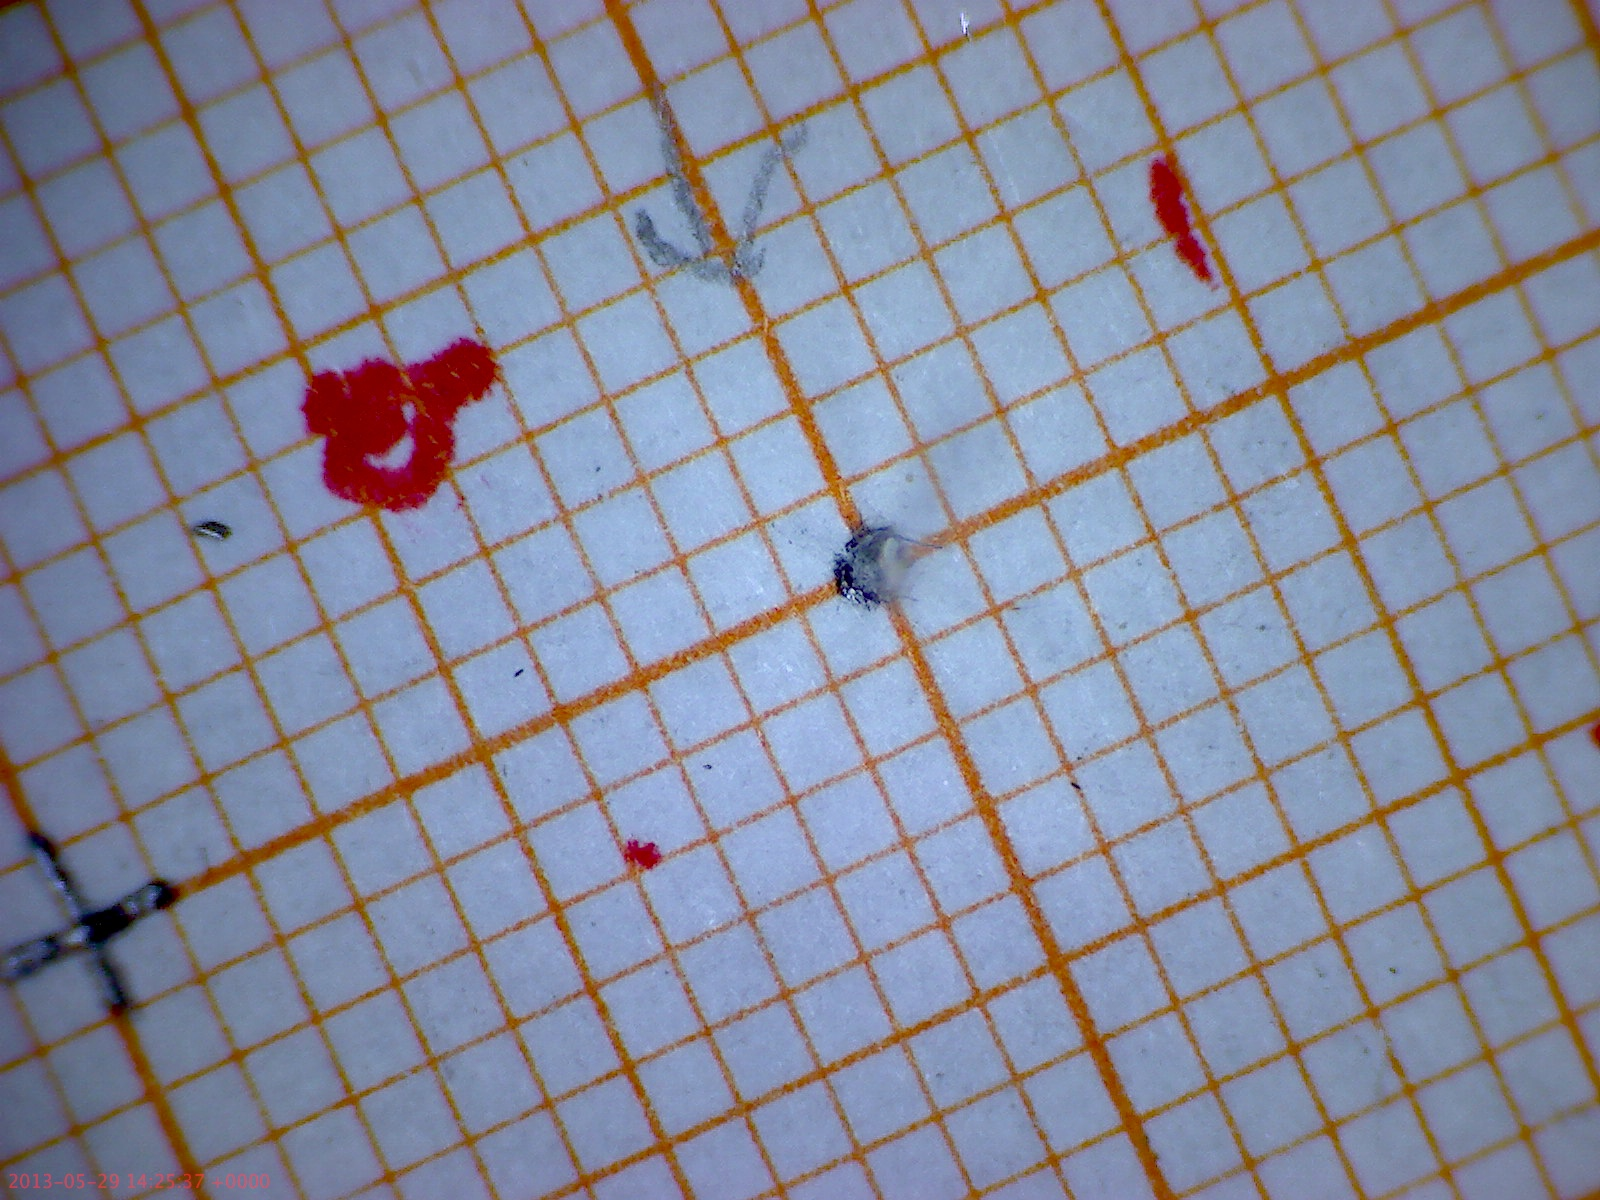
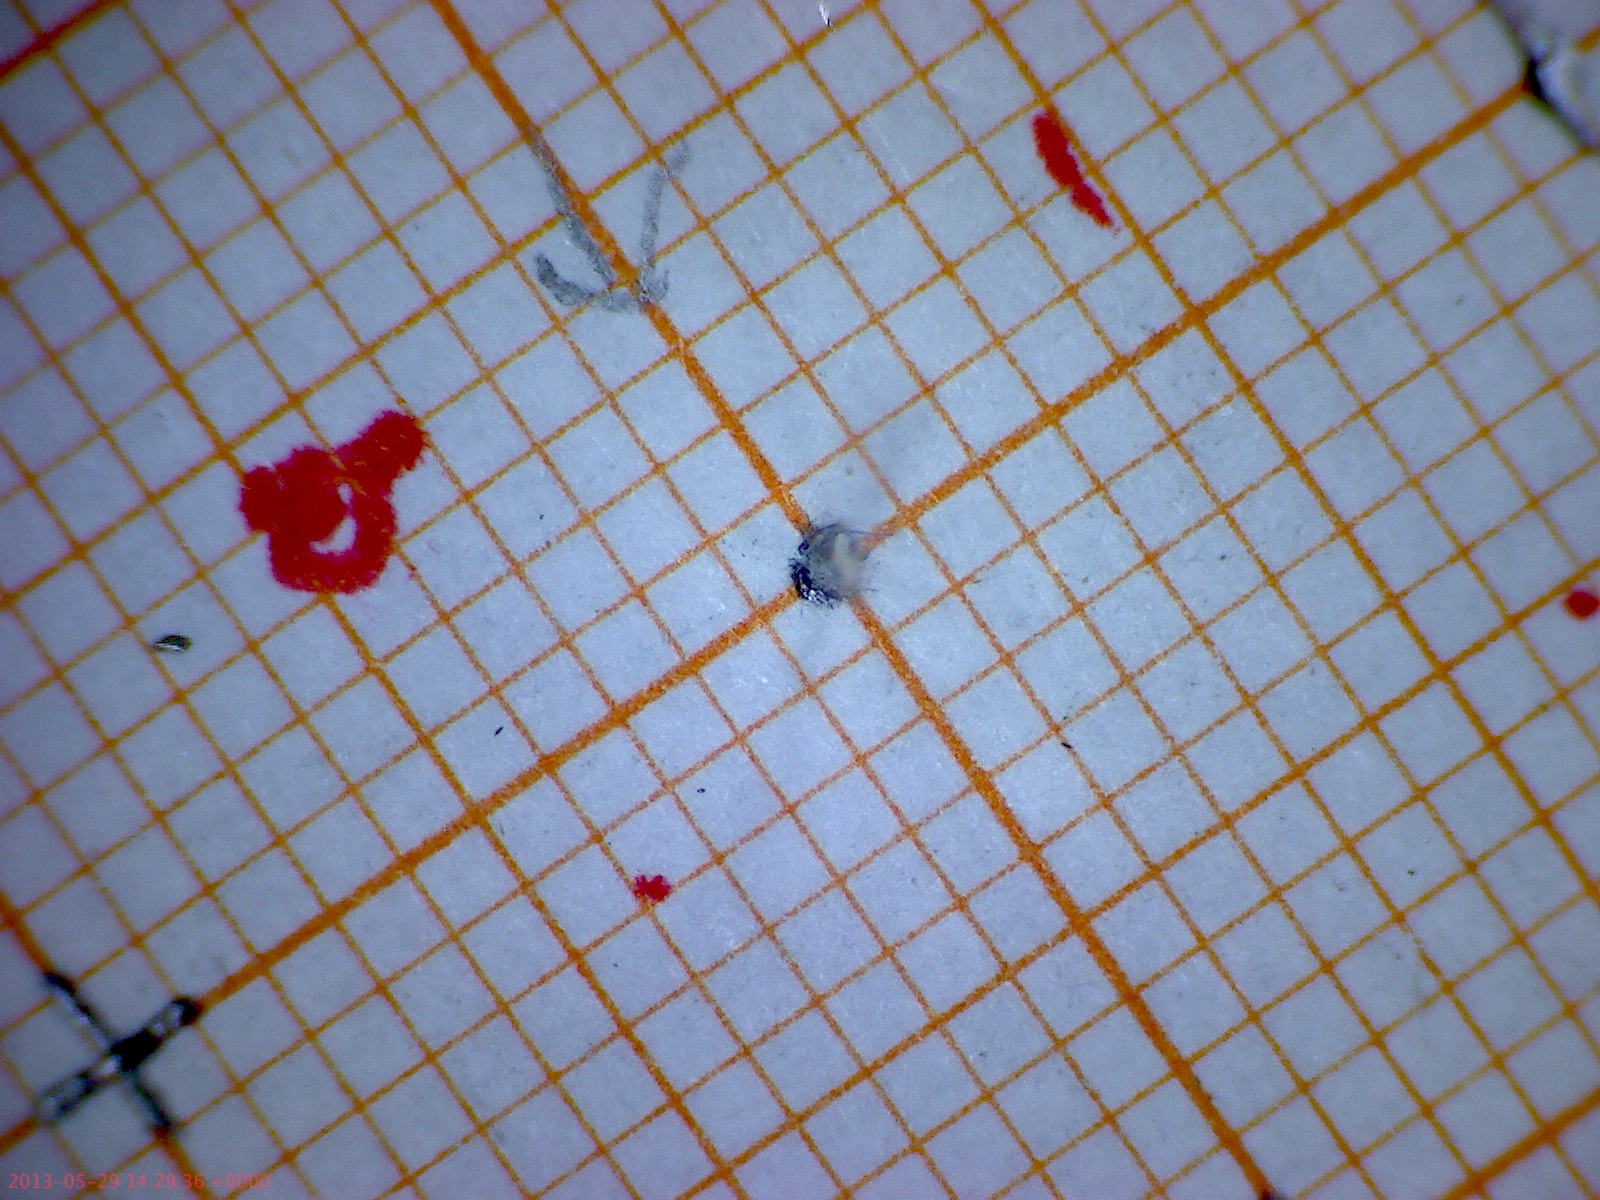
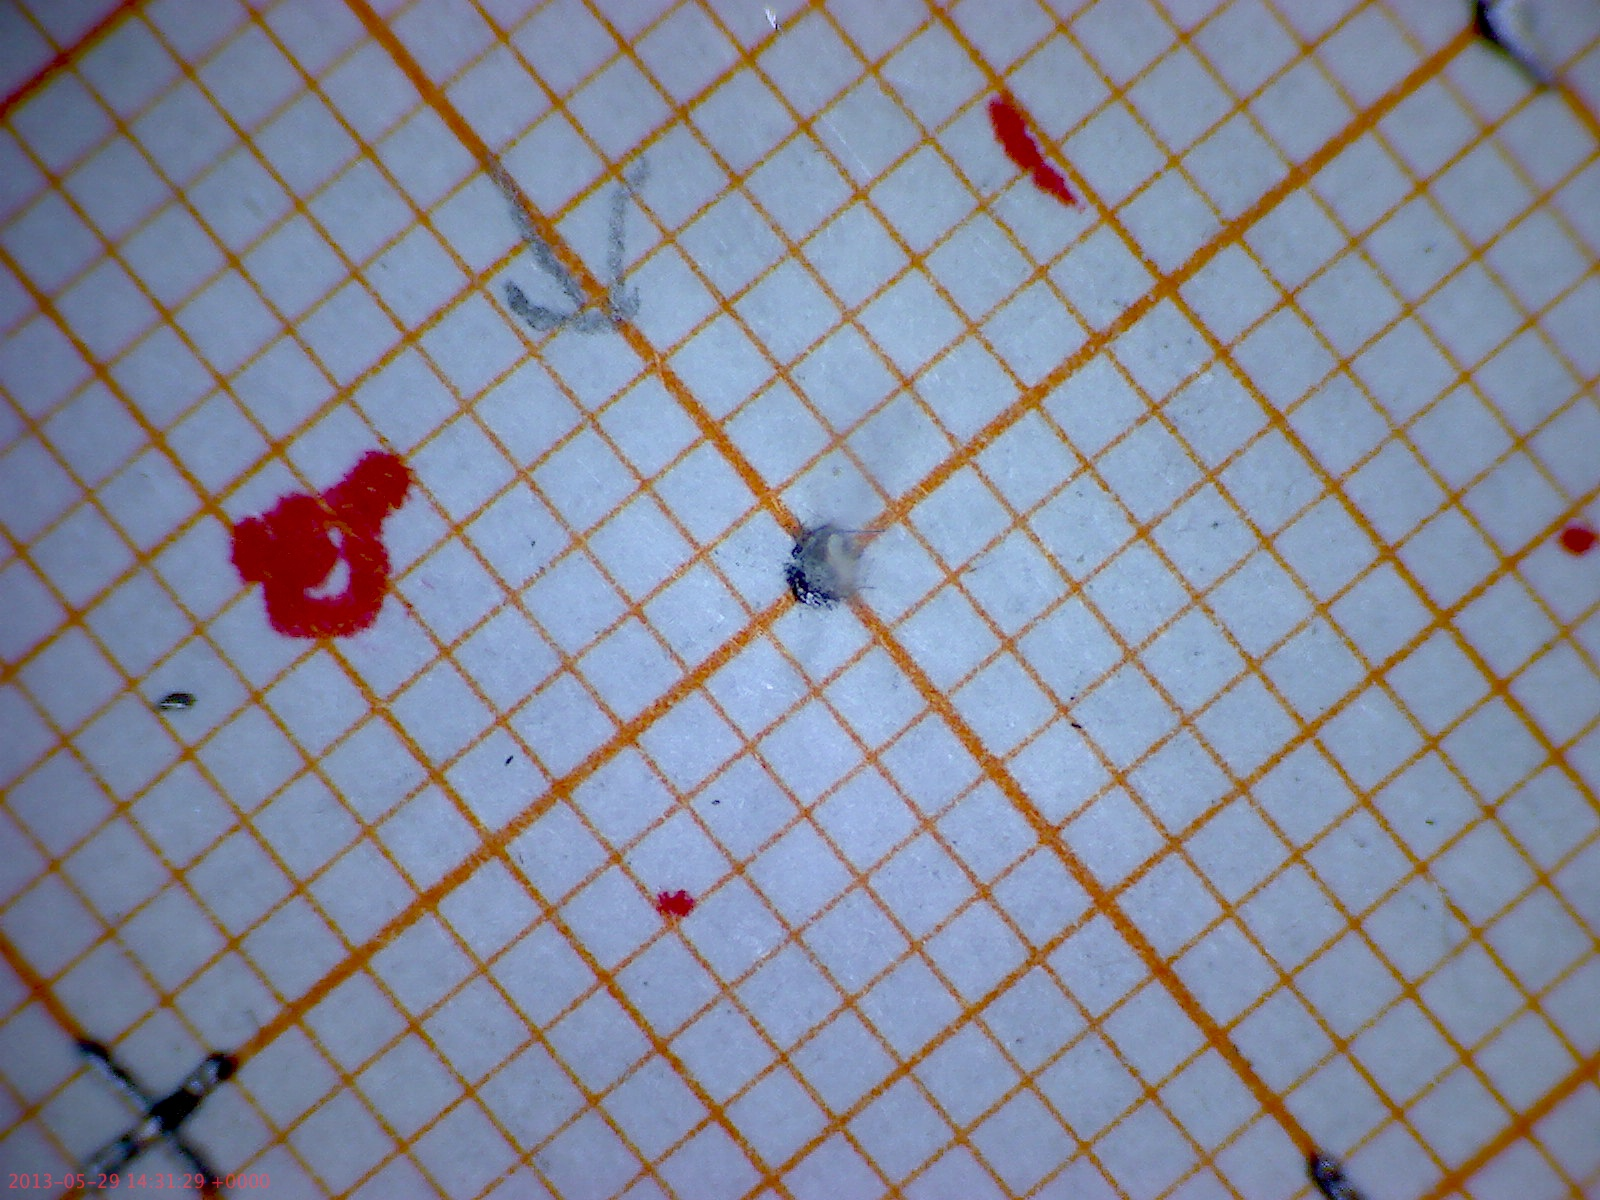
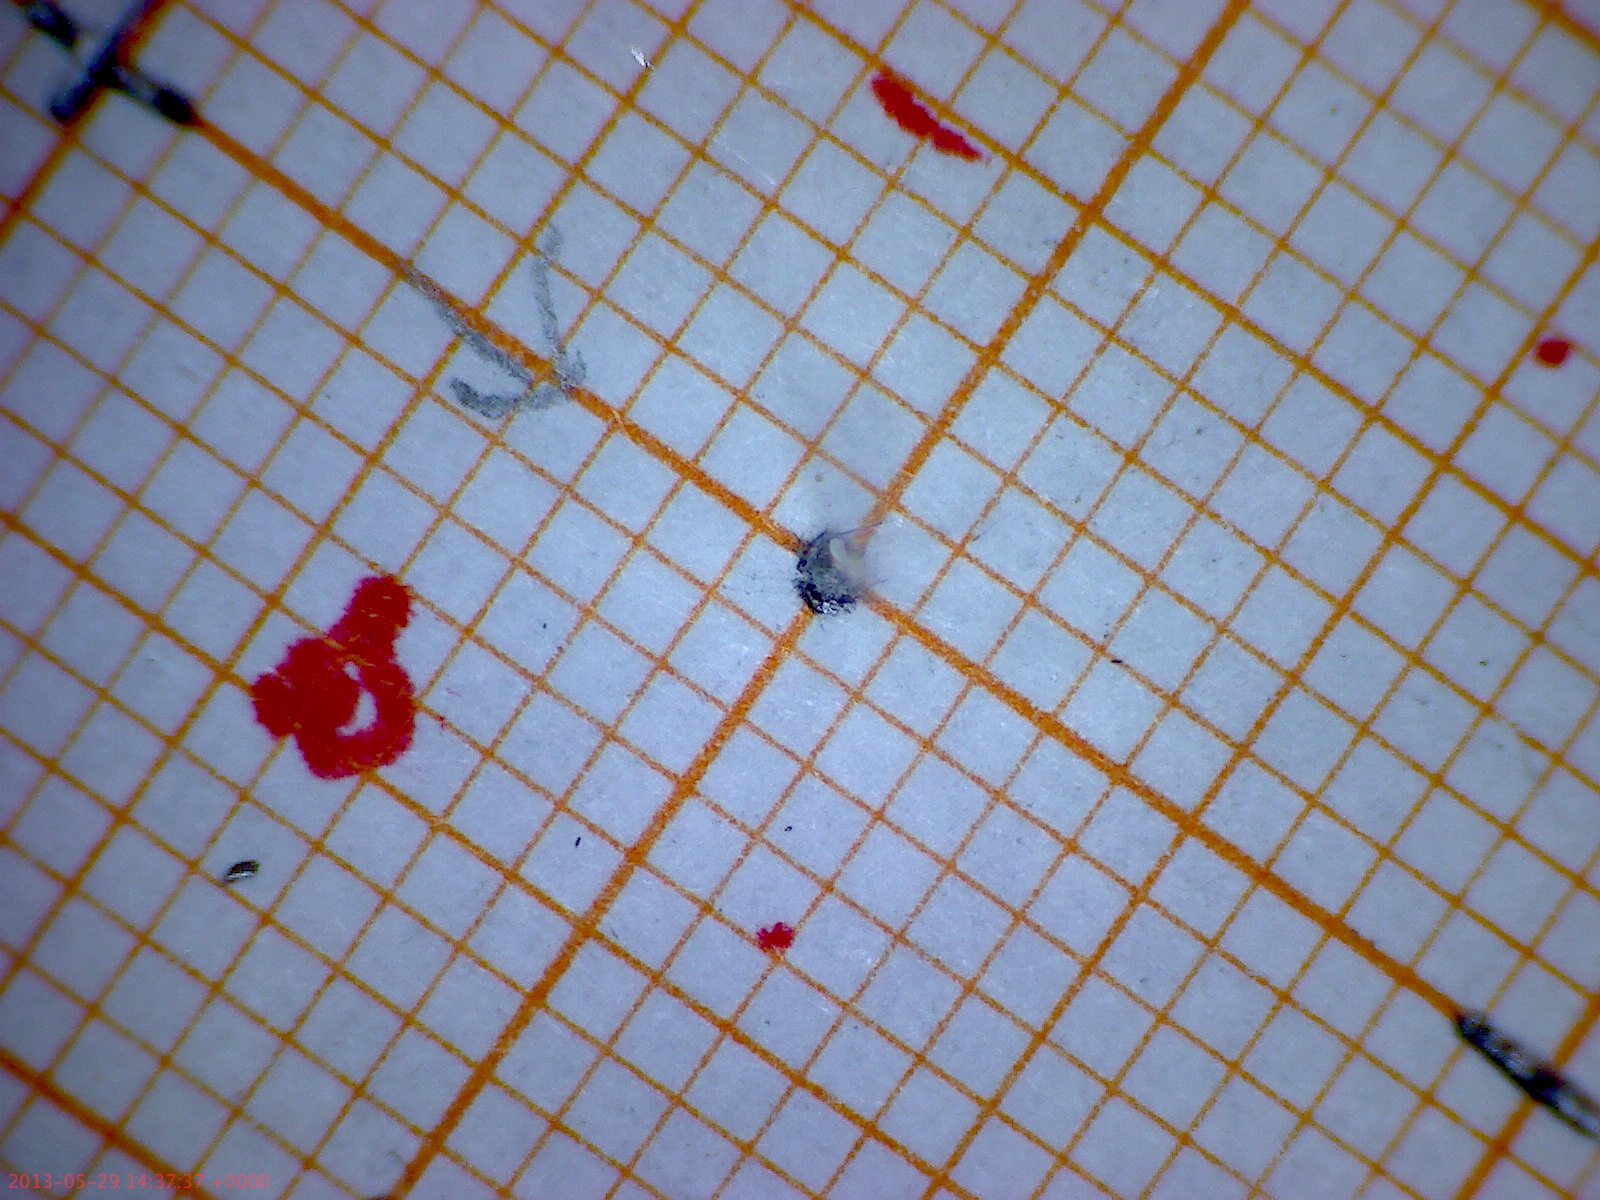
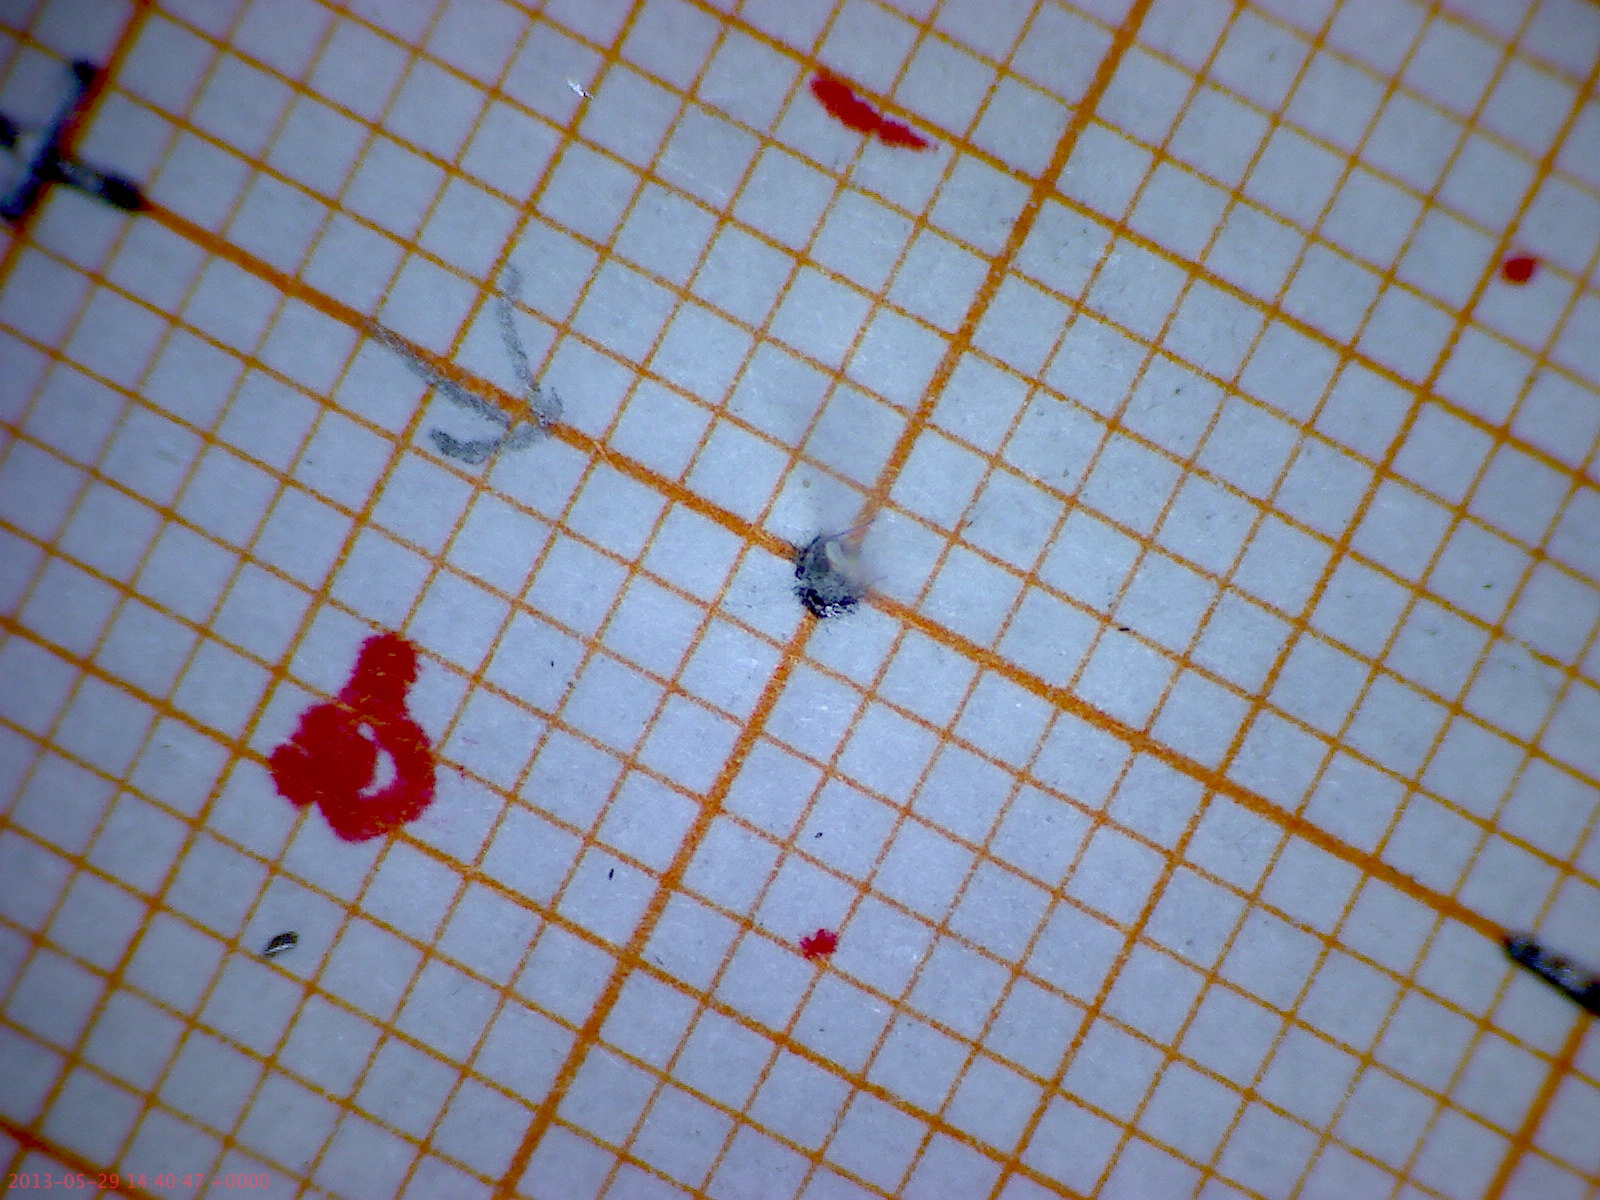
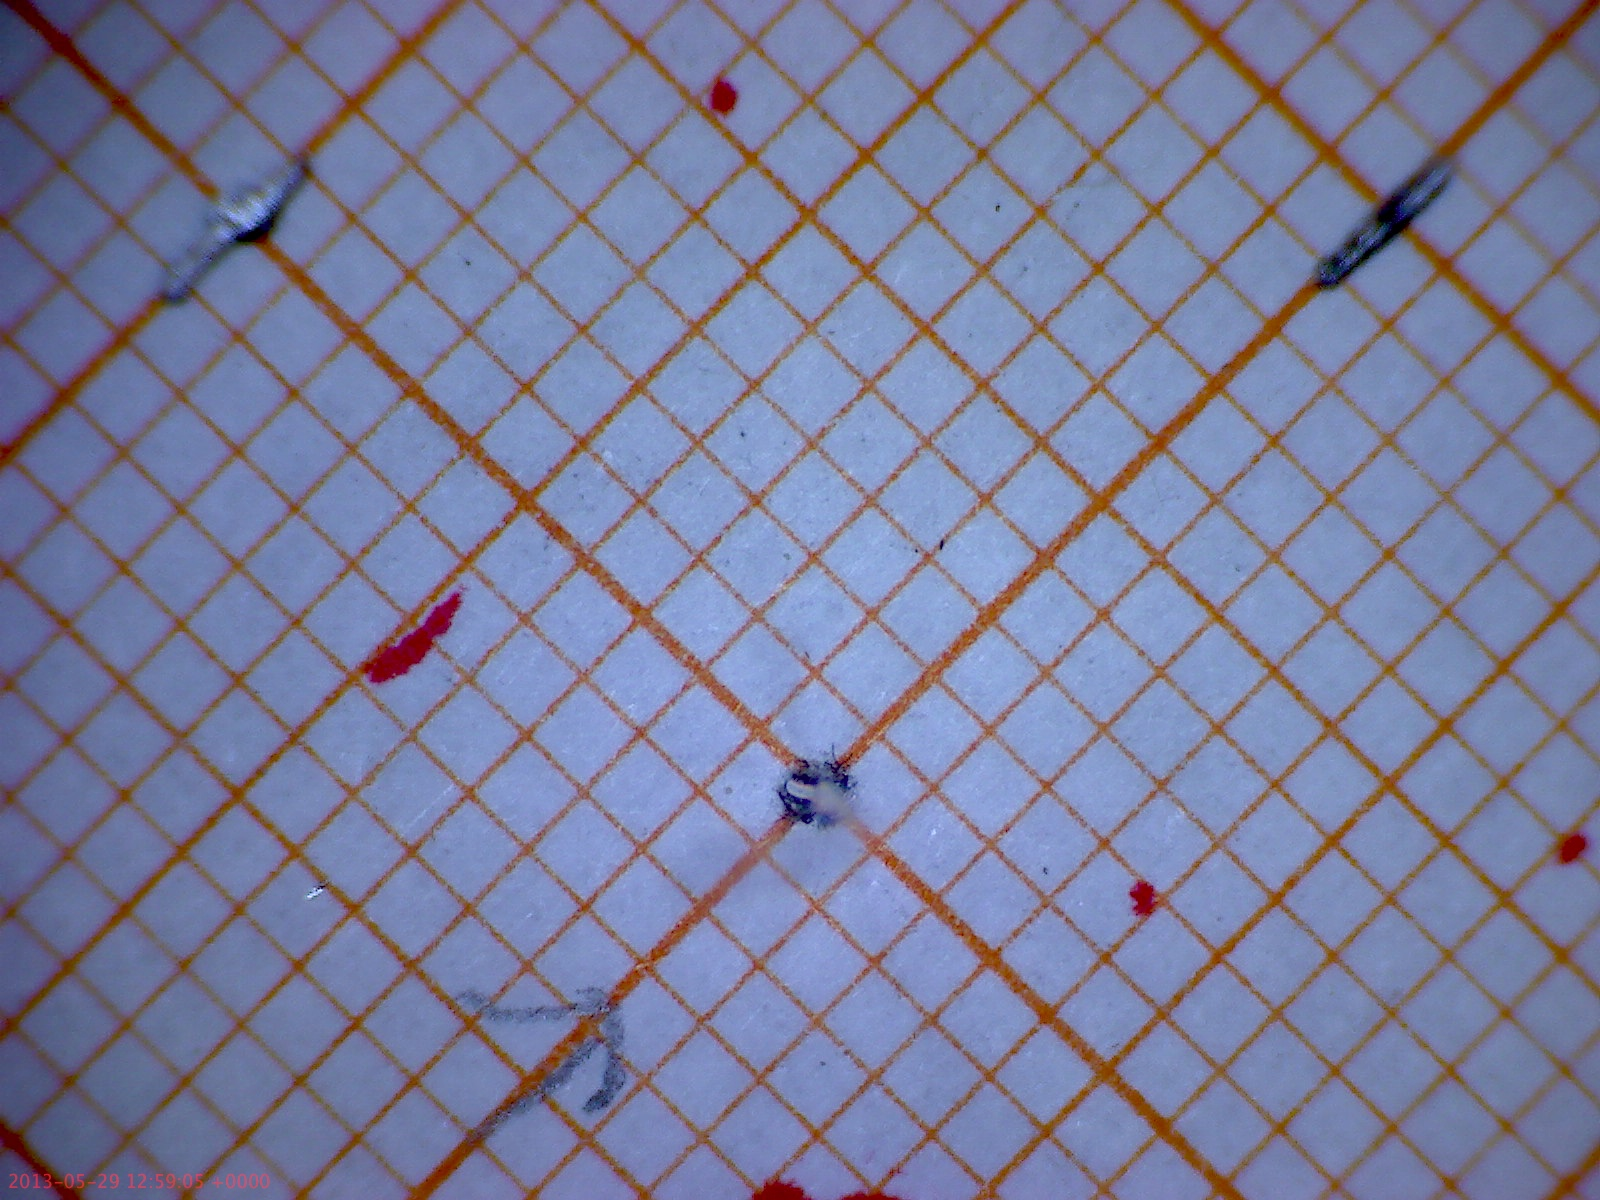
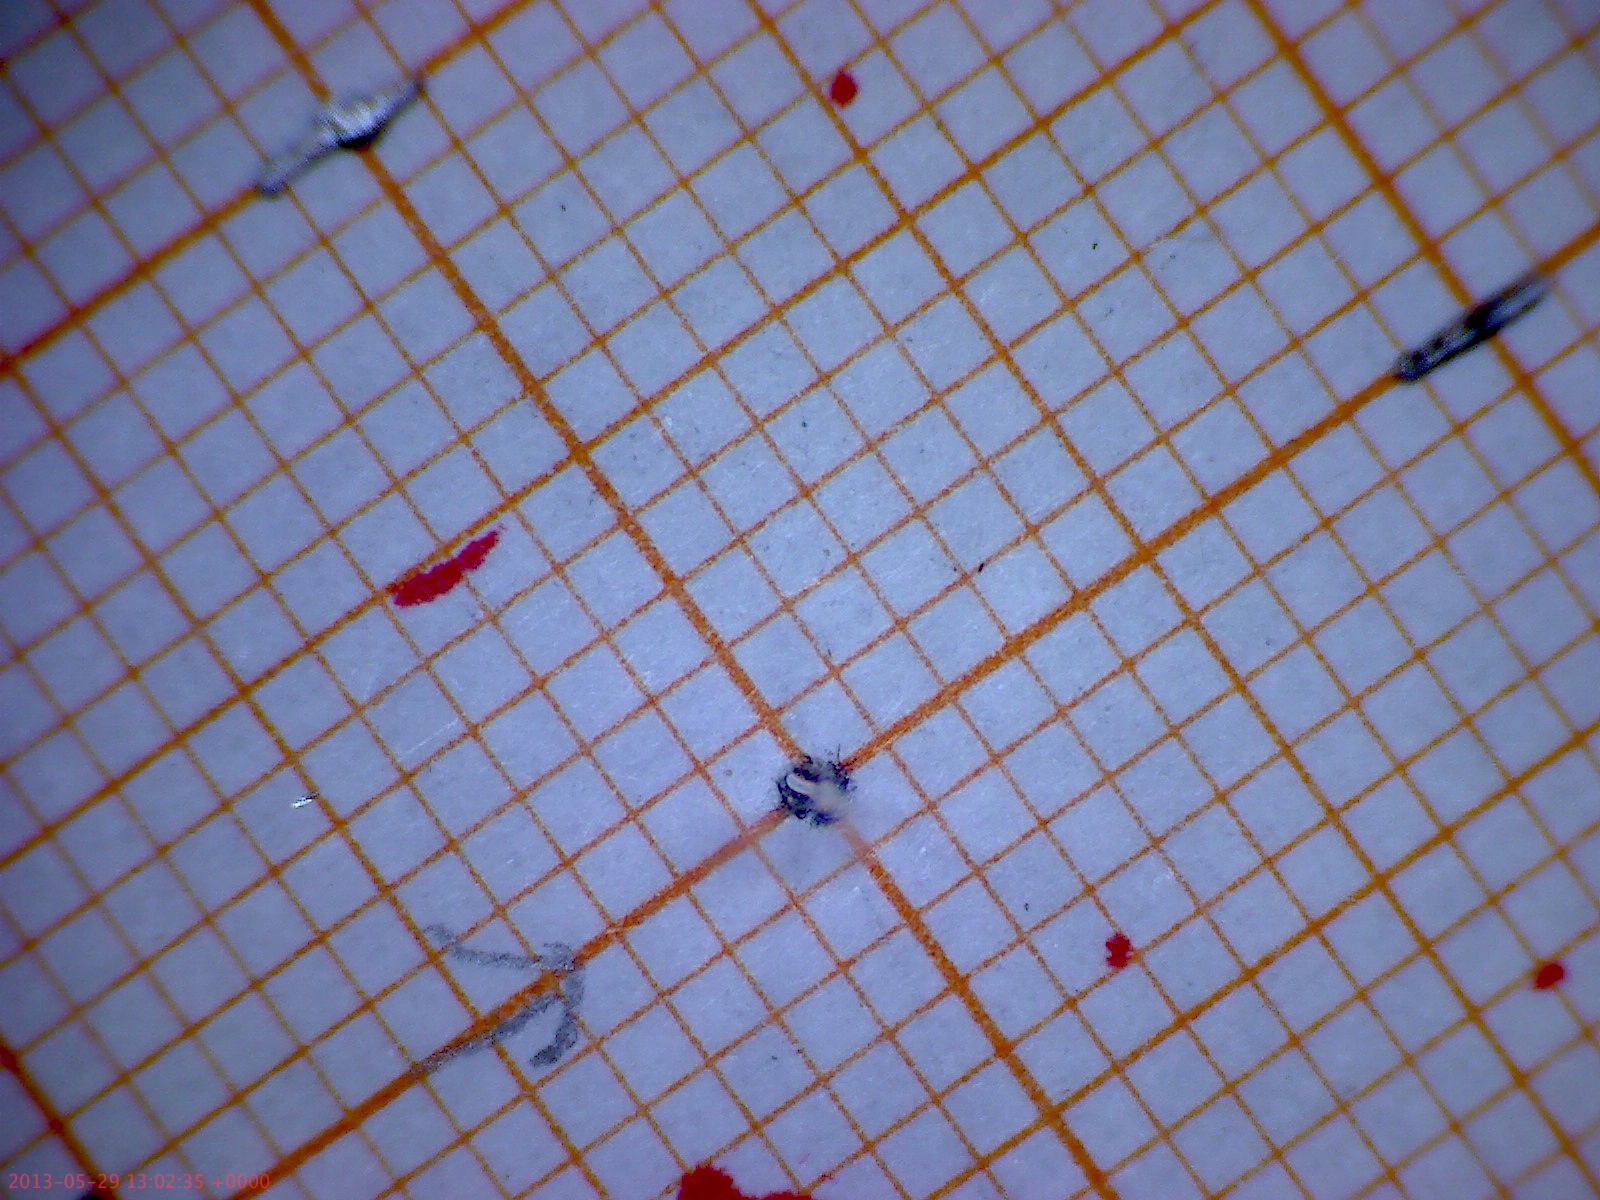
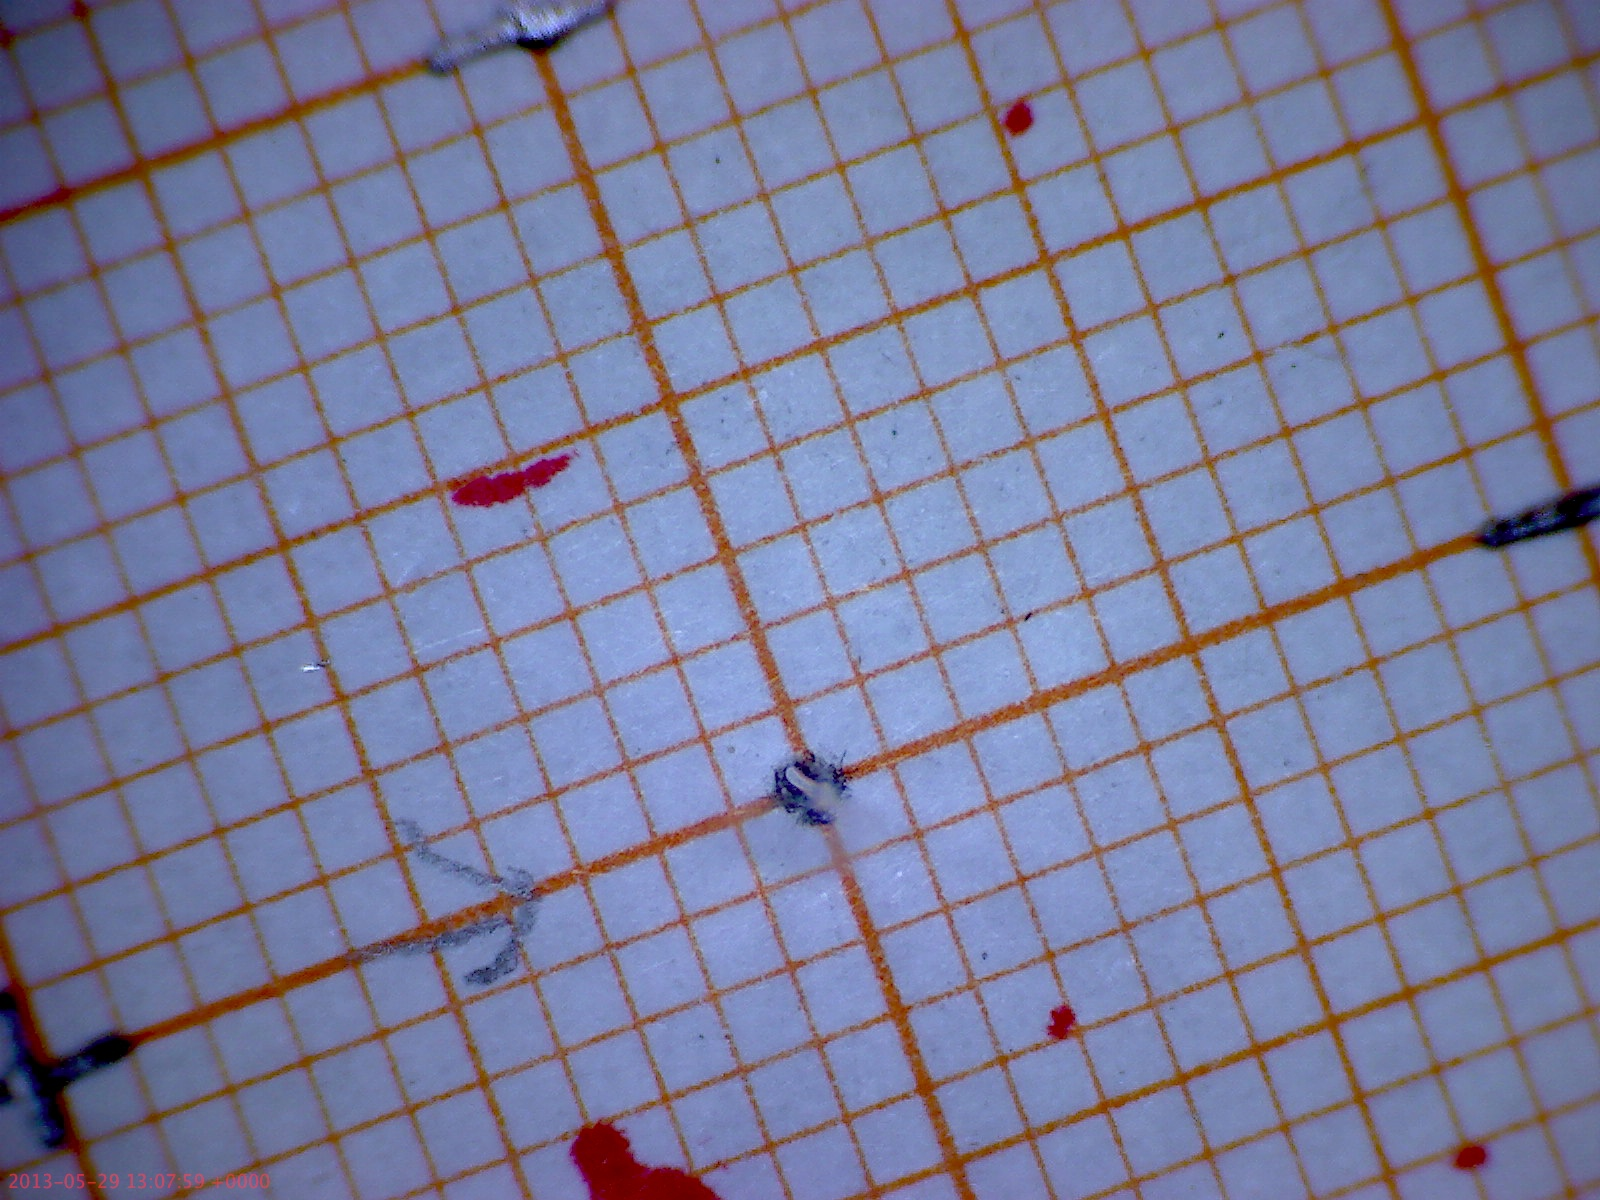
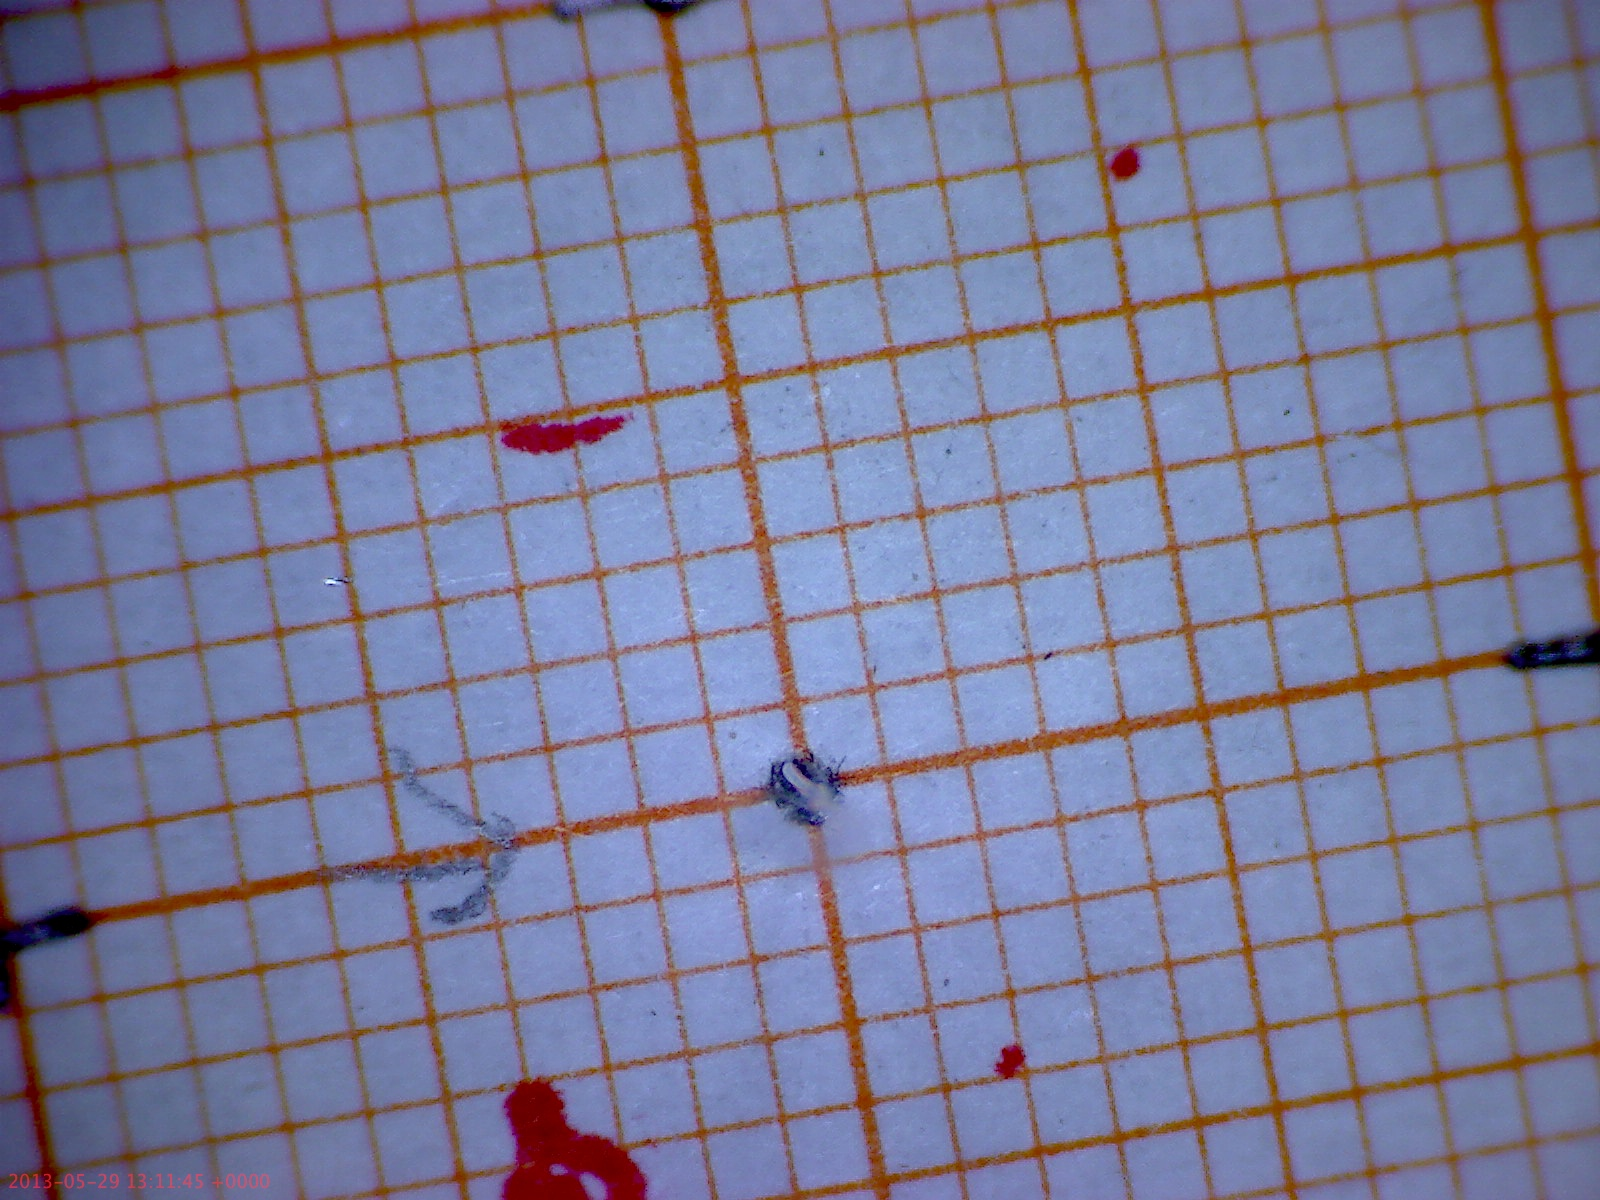
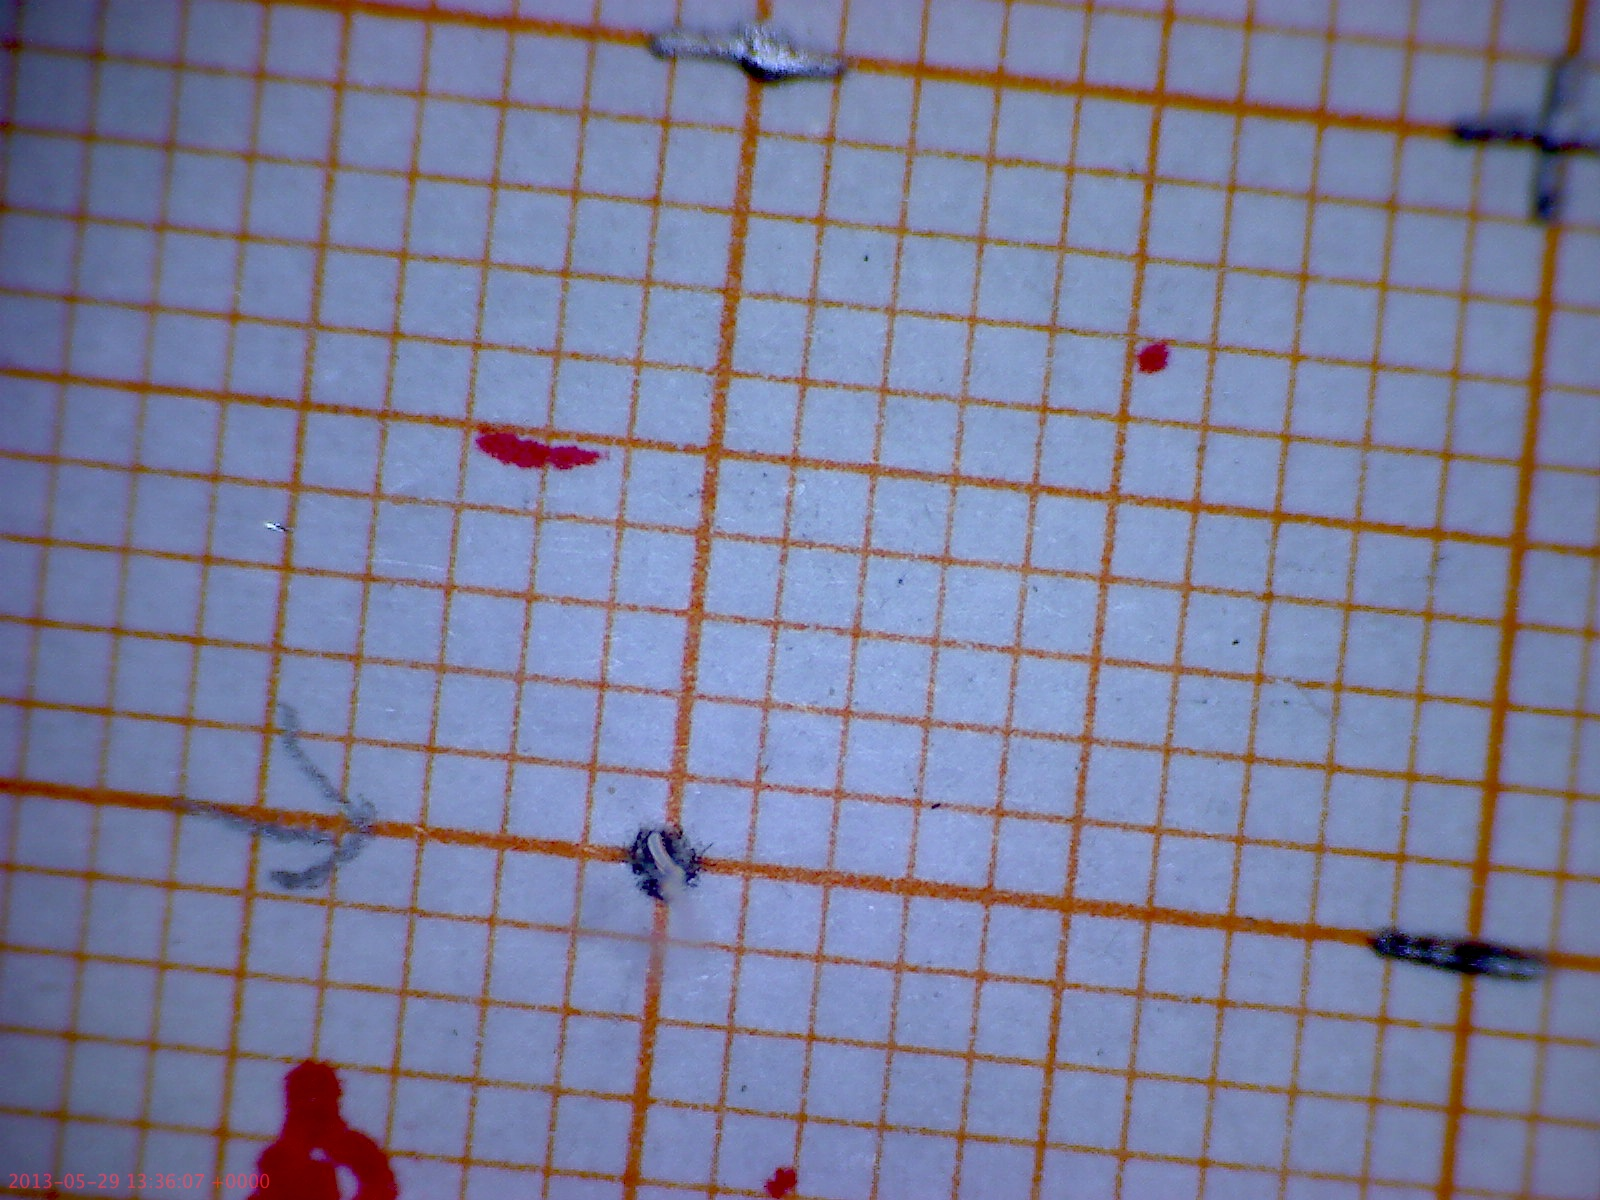
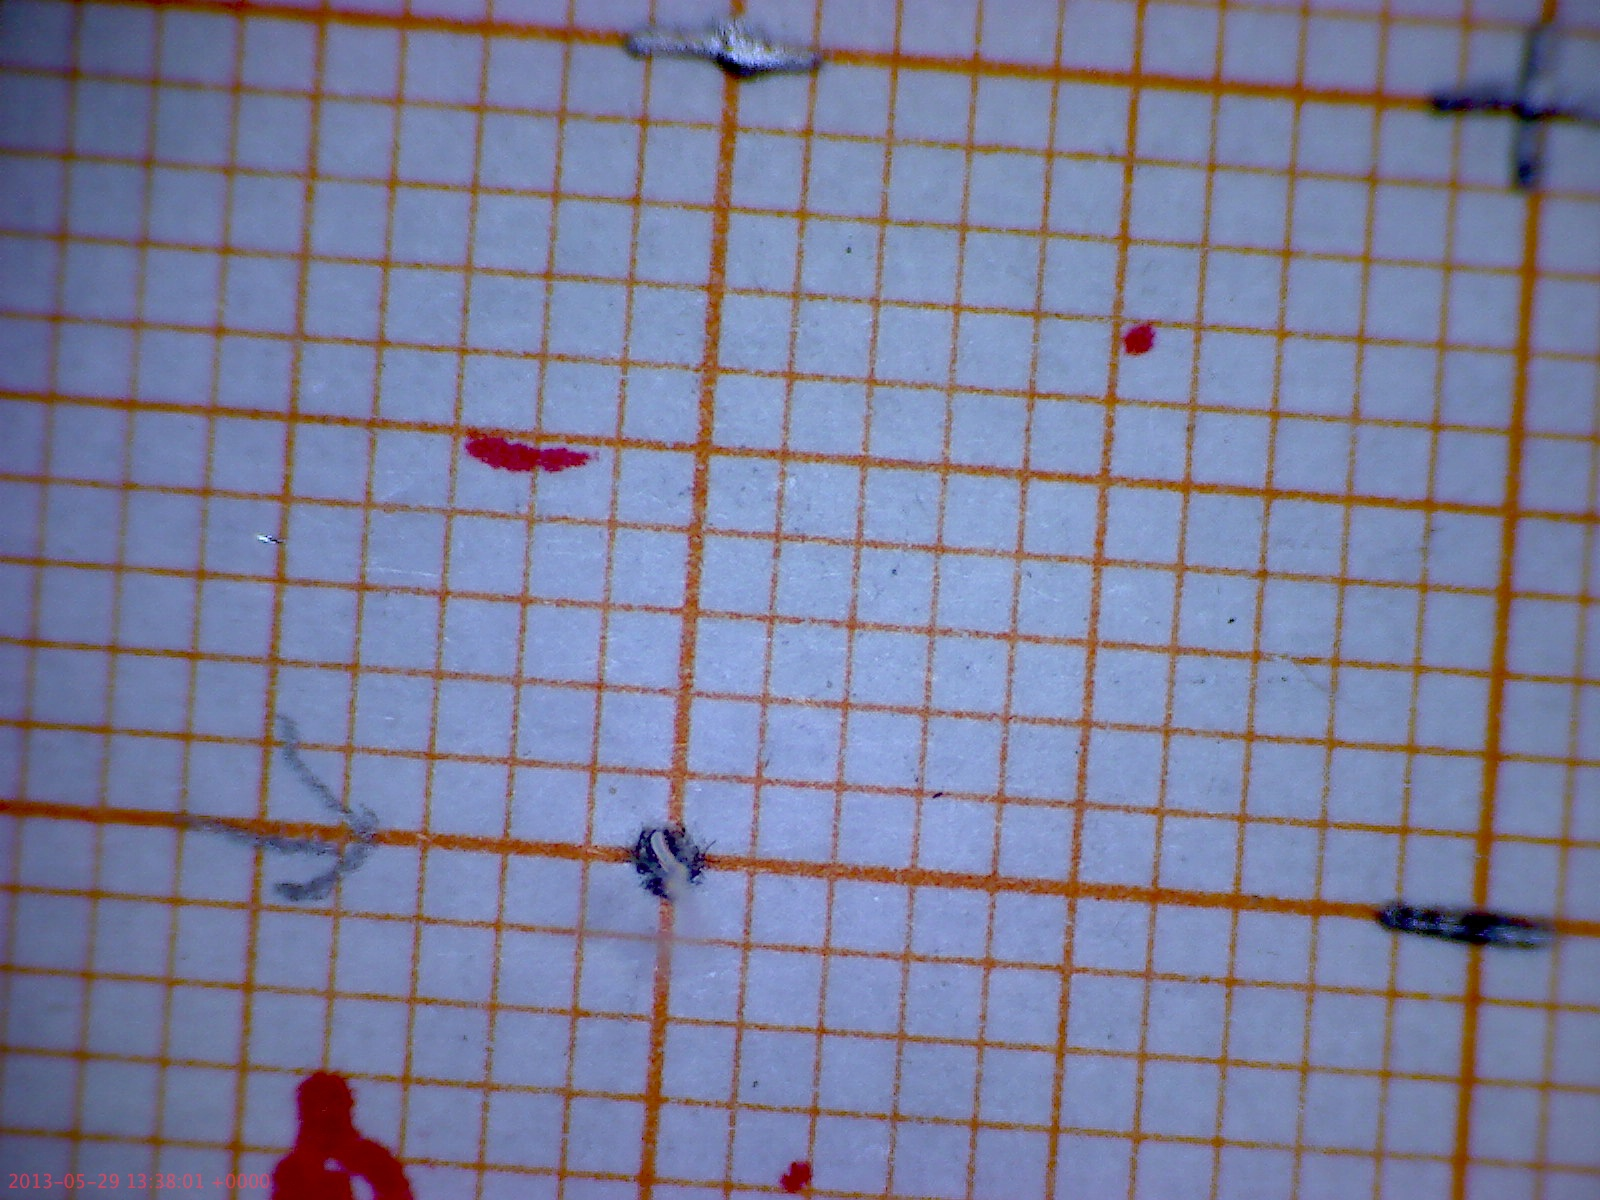
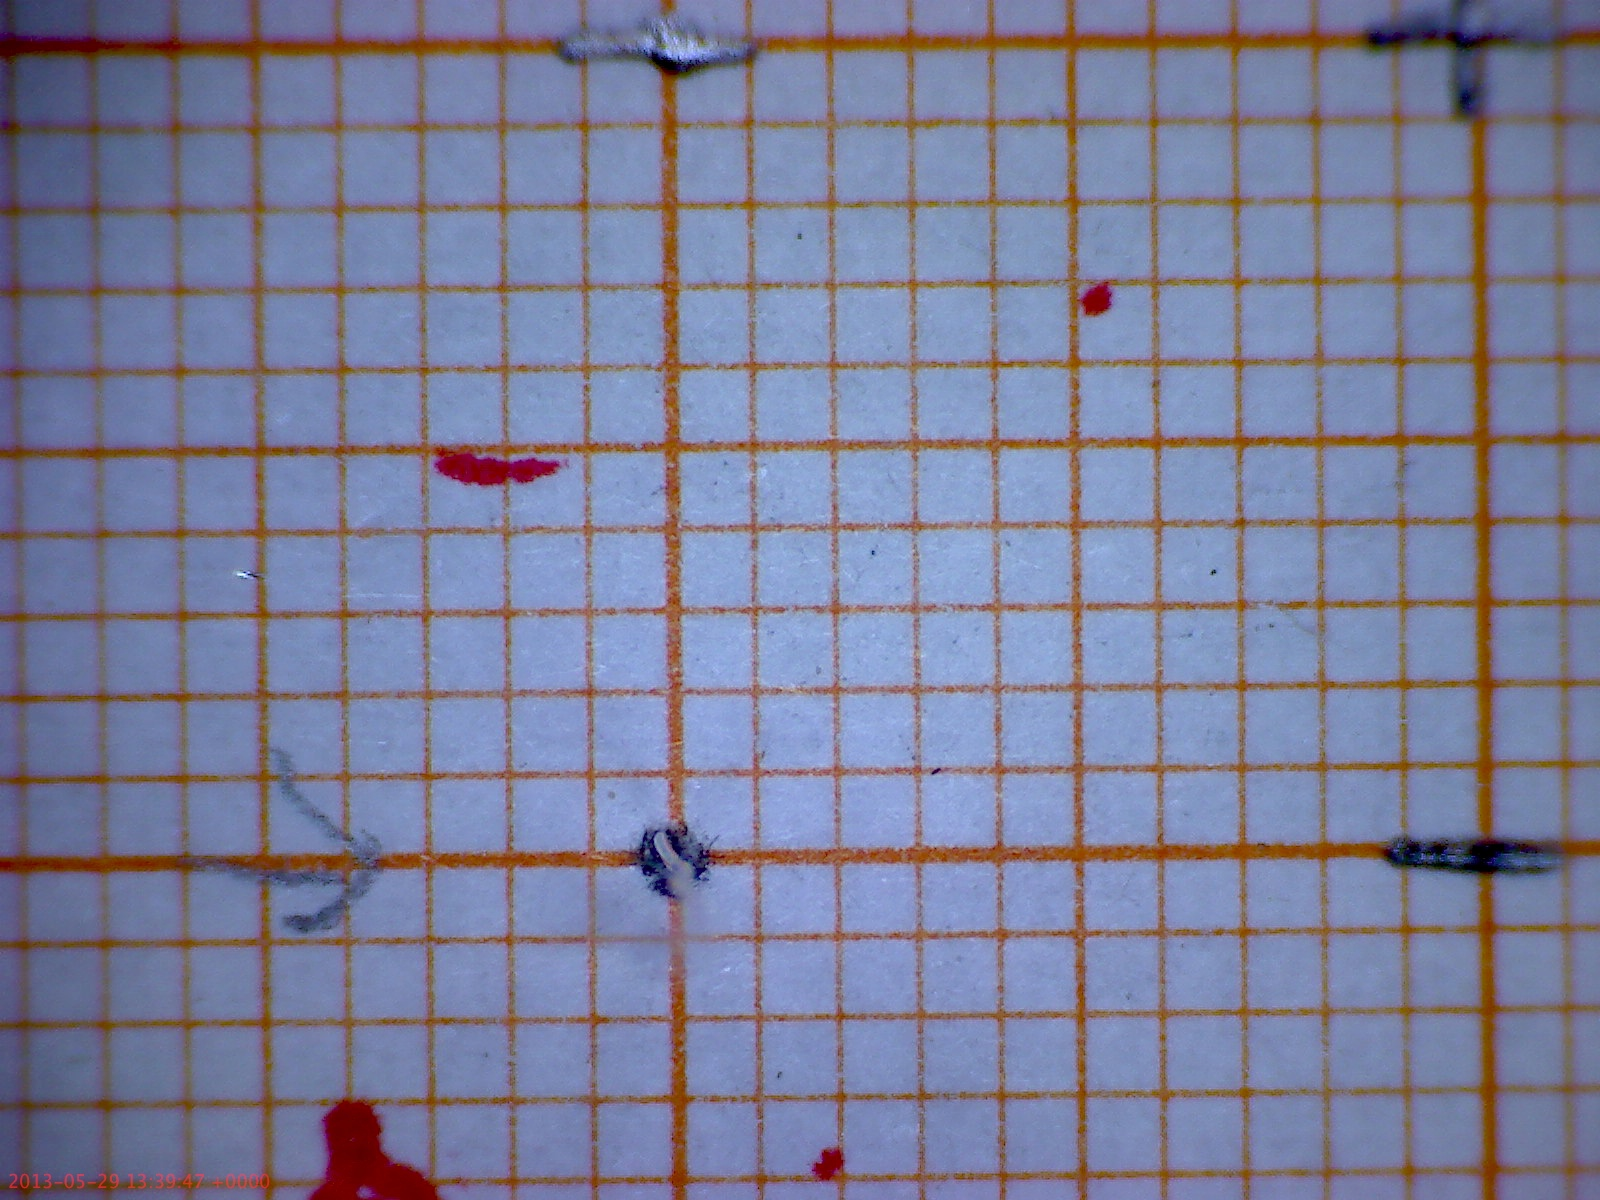
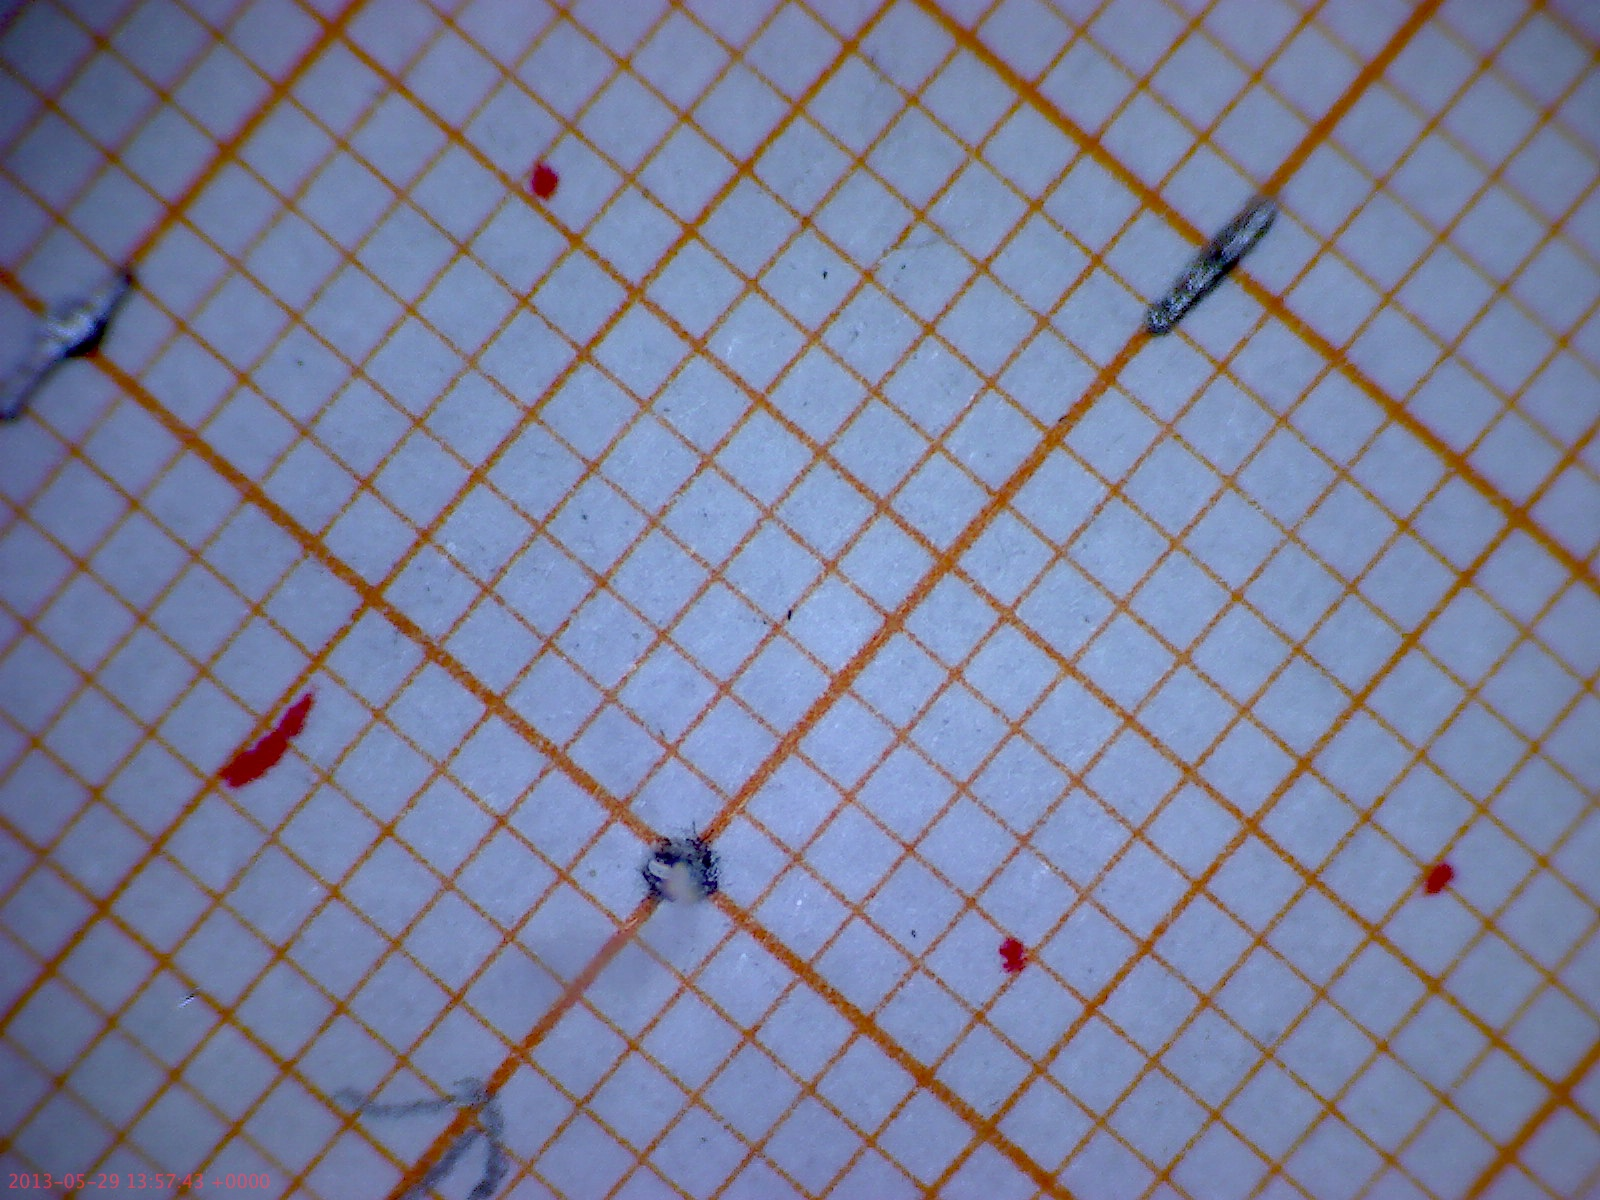
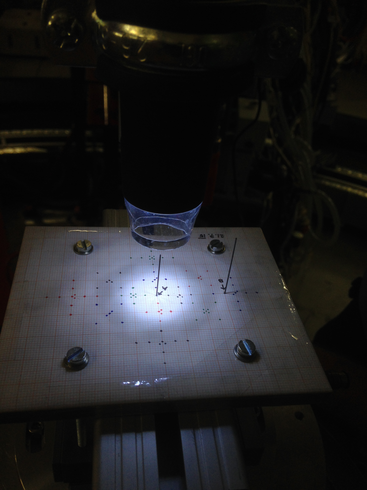
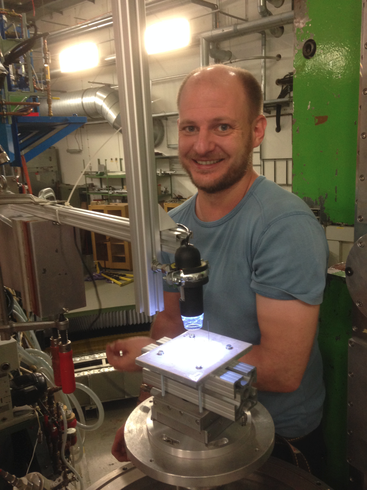
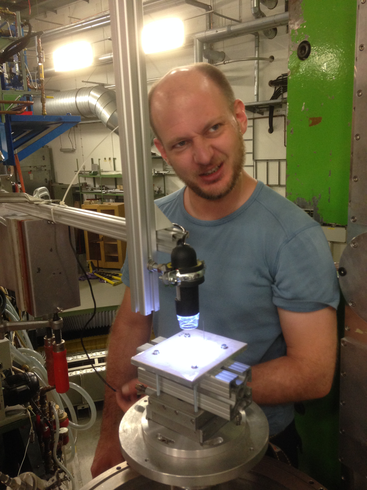
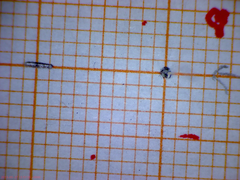
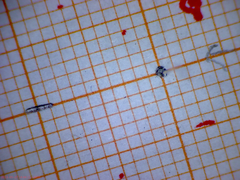
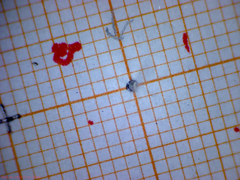
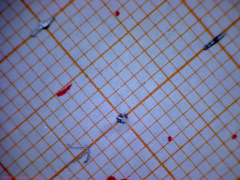
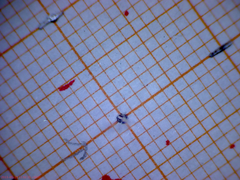
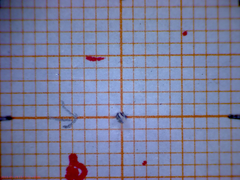
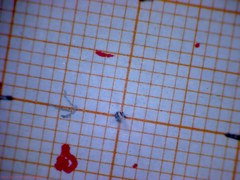
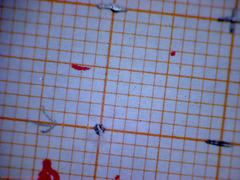
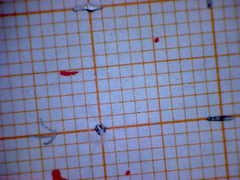
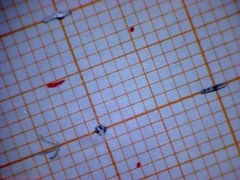
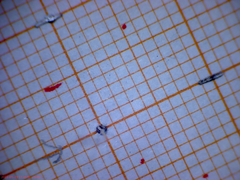
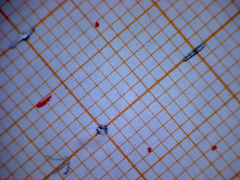
First we developed a special target (see picture below), which consists
of millimeter paper for a precise readout of the position and two carbon
antennas, to precisely position the target at the center of the experimental
hall with the use of the theodolites.
Then we installed a digital microscope on each of the spectrometers and
recorded the pictures of the target while rotating the spectrometer from
the minimal possible to the maximal possible angle.
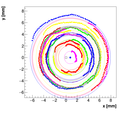
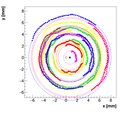
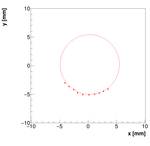
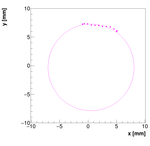
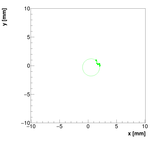
By monitoring how the points on the target move (ideally on circles)
one can determine a common center using minimization algorithm.
To readout the points a special program was used, which converts
images to the set of points in a properly aligned and normalized
coordinate system.
The analysis was done together with a Slowenian summer student Peter Zaksek.
And everybody knows Soeren :)
Data:
The set of images collected in the experiment is stored in
the given tarball file:
PivotRawPhotos.tgz
Notes:
Here are notes made during our experiment, which contain
information about the precise positions of the spectrometers.
Pivot_174741.PDF
Pivot_175222.PDF
Pivot_175439.PDF
Pivot_175600.PDF
Pivot_175714.PDF
Data for the analysis:
Here are the files prepared to be used in the analysis. Each file
contains spectrometer angles, and position (x,y) of a selected point on the
target:
DataForAnalysisA.dat
DataForAnalysisB.dat
DataForAnalysisC.dat
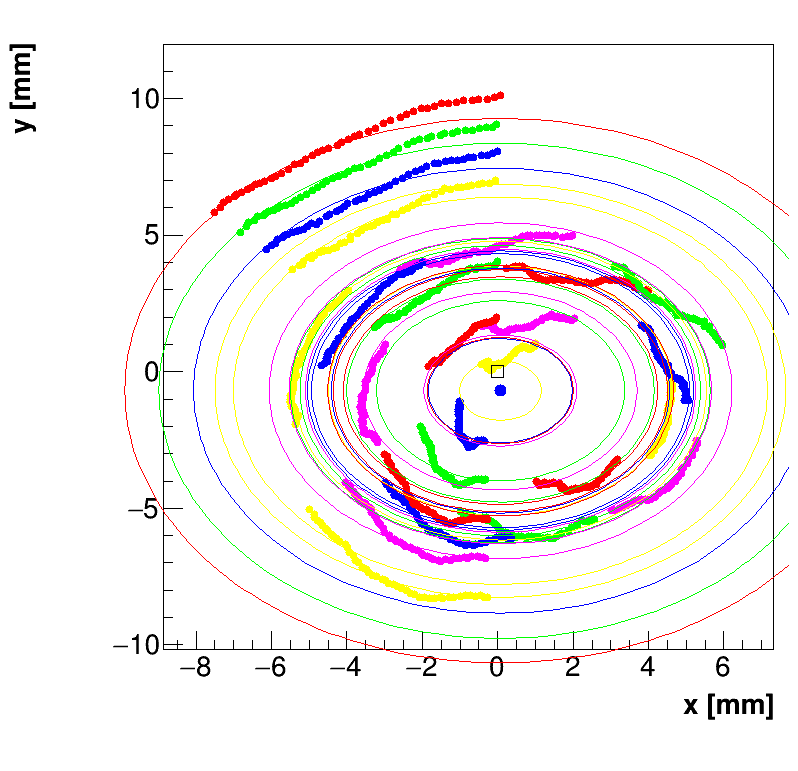
Procedure:
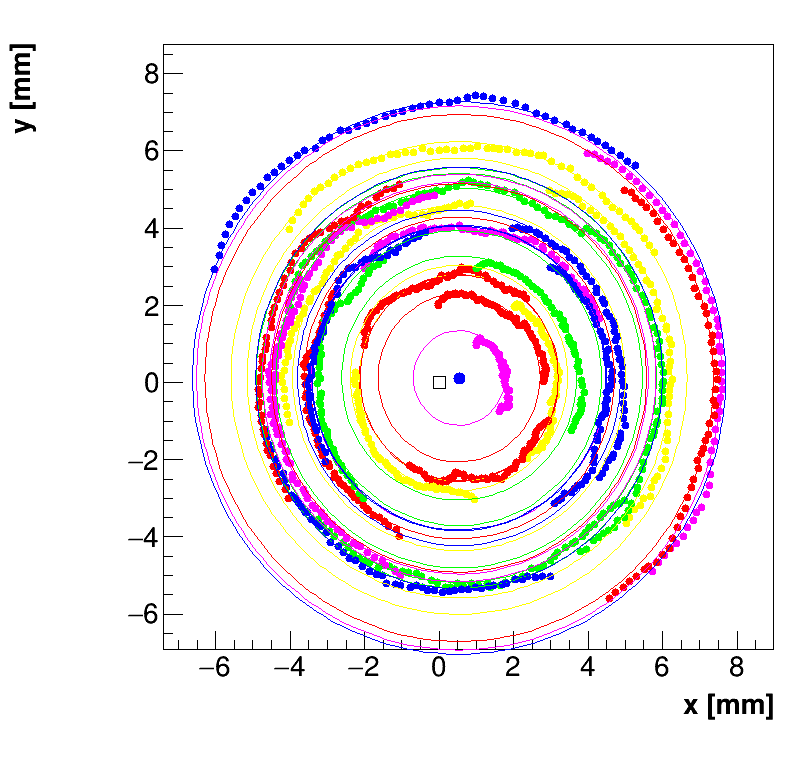
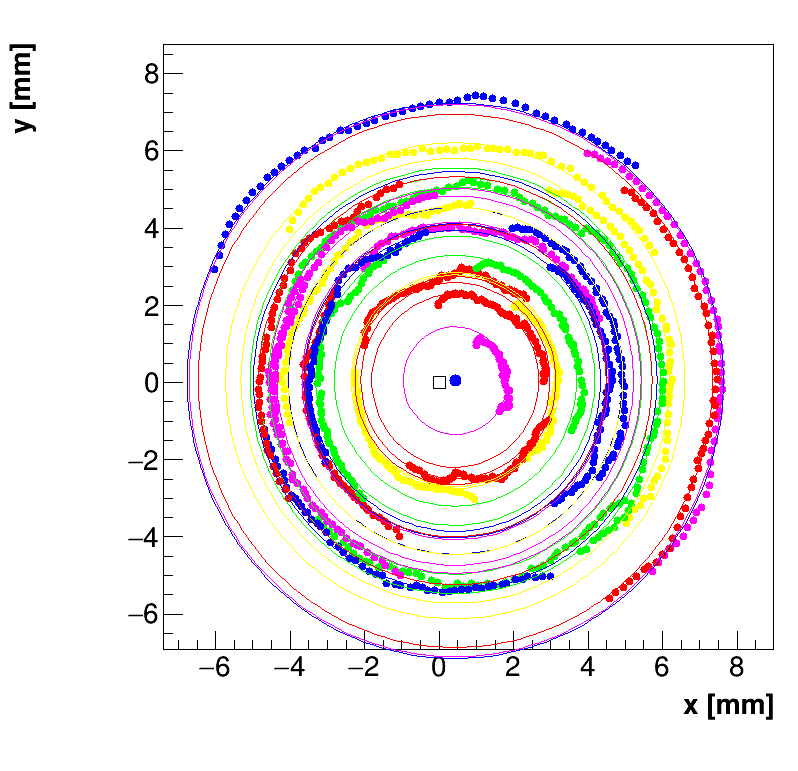
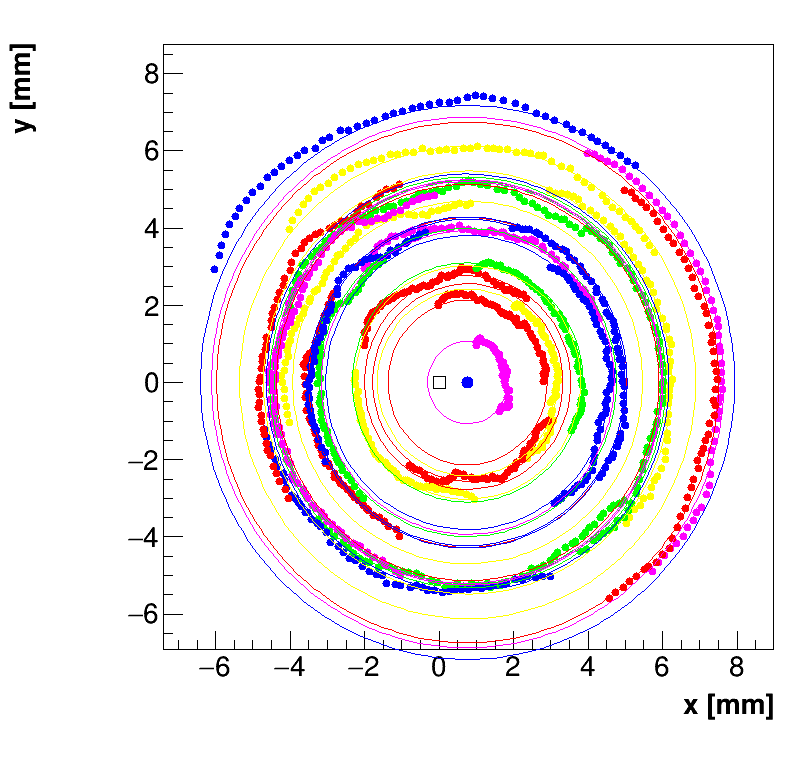
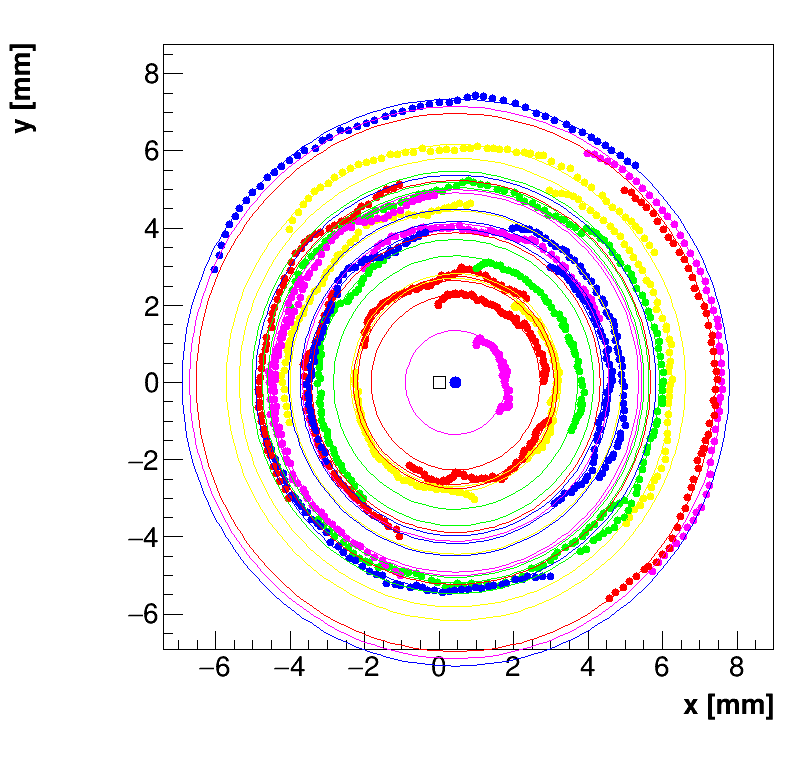
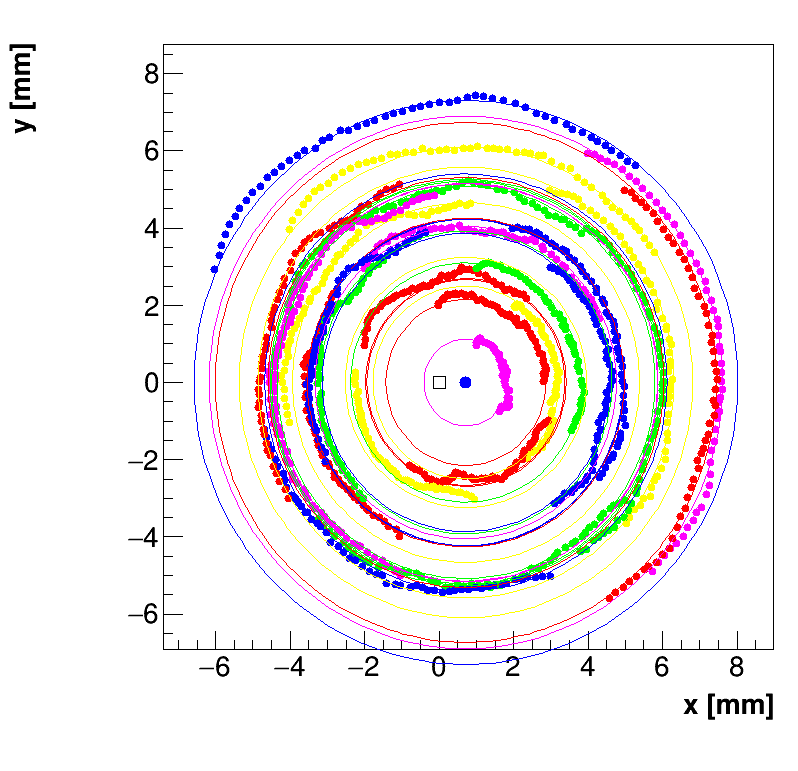
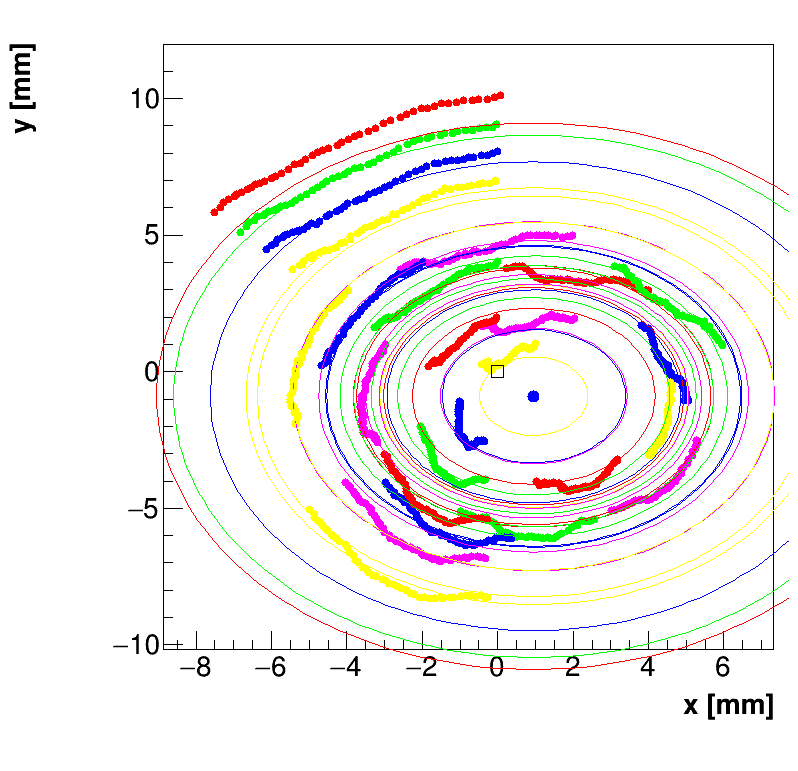
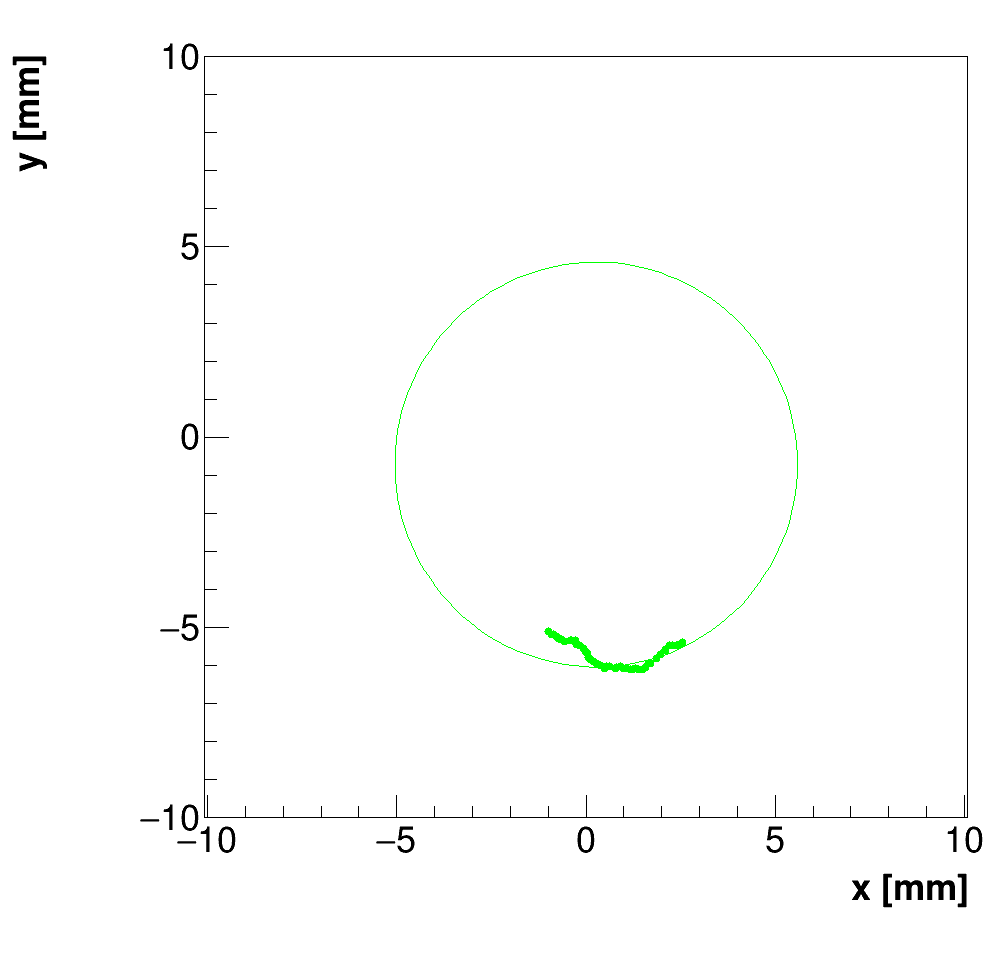
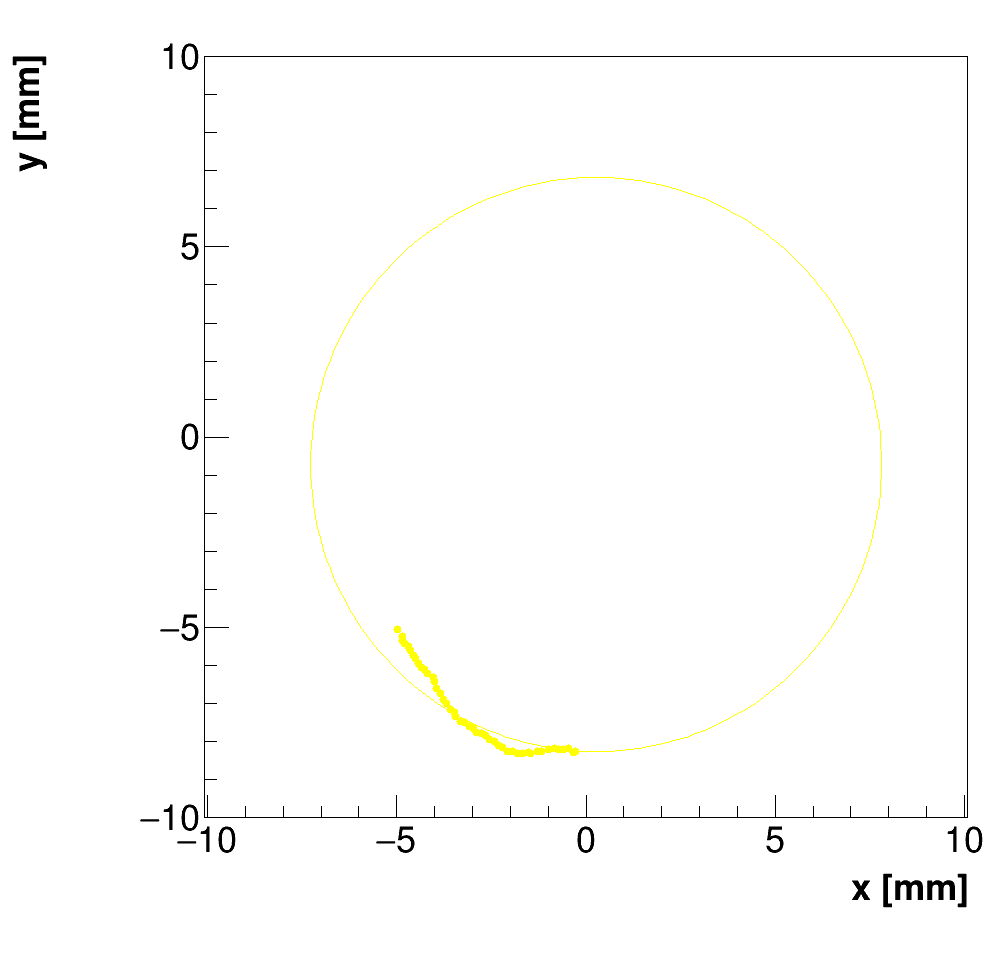
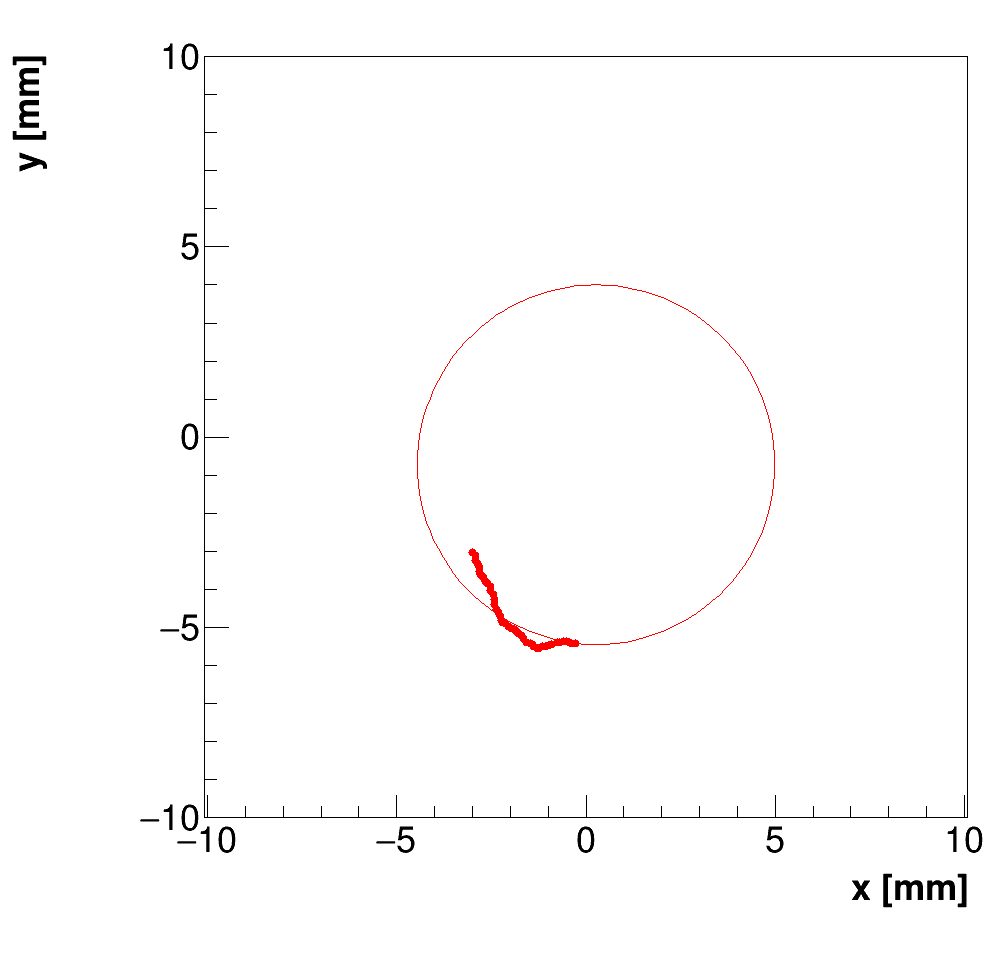
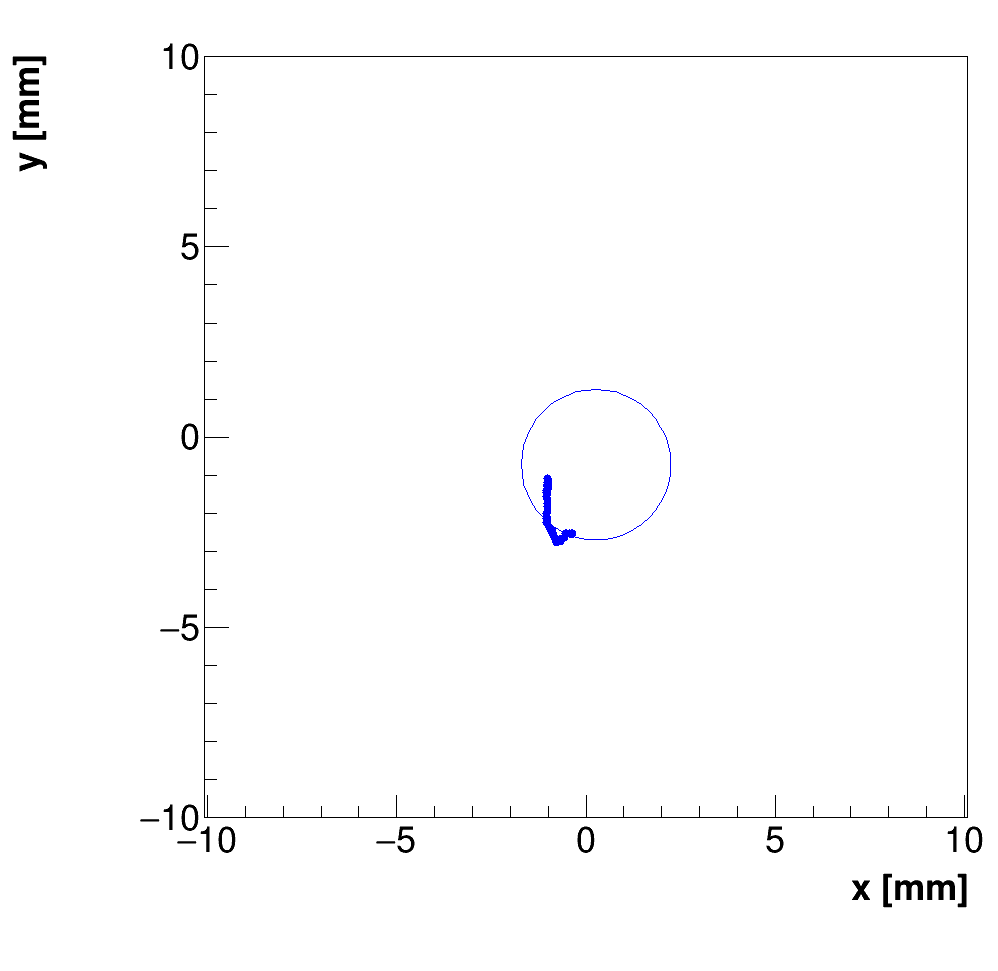
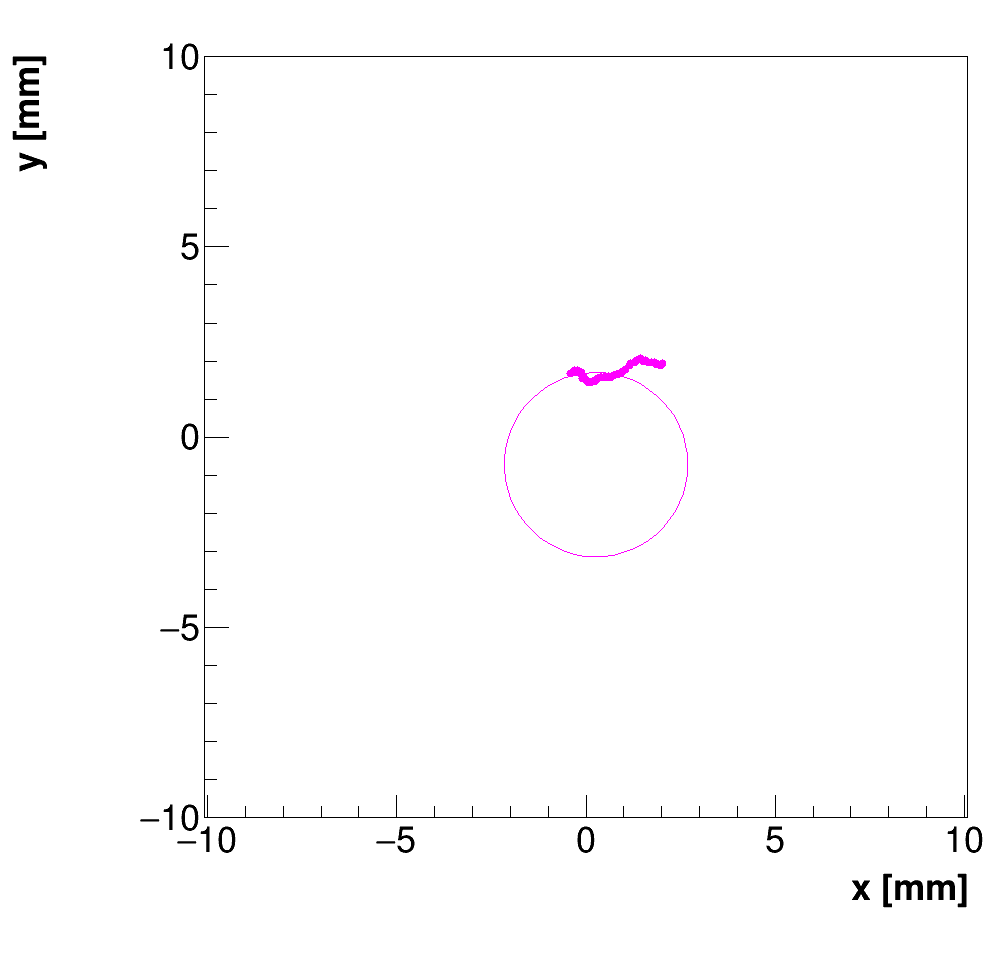
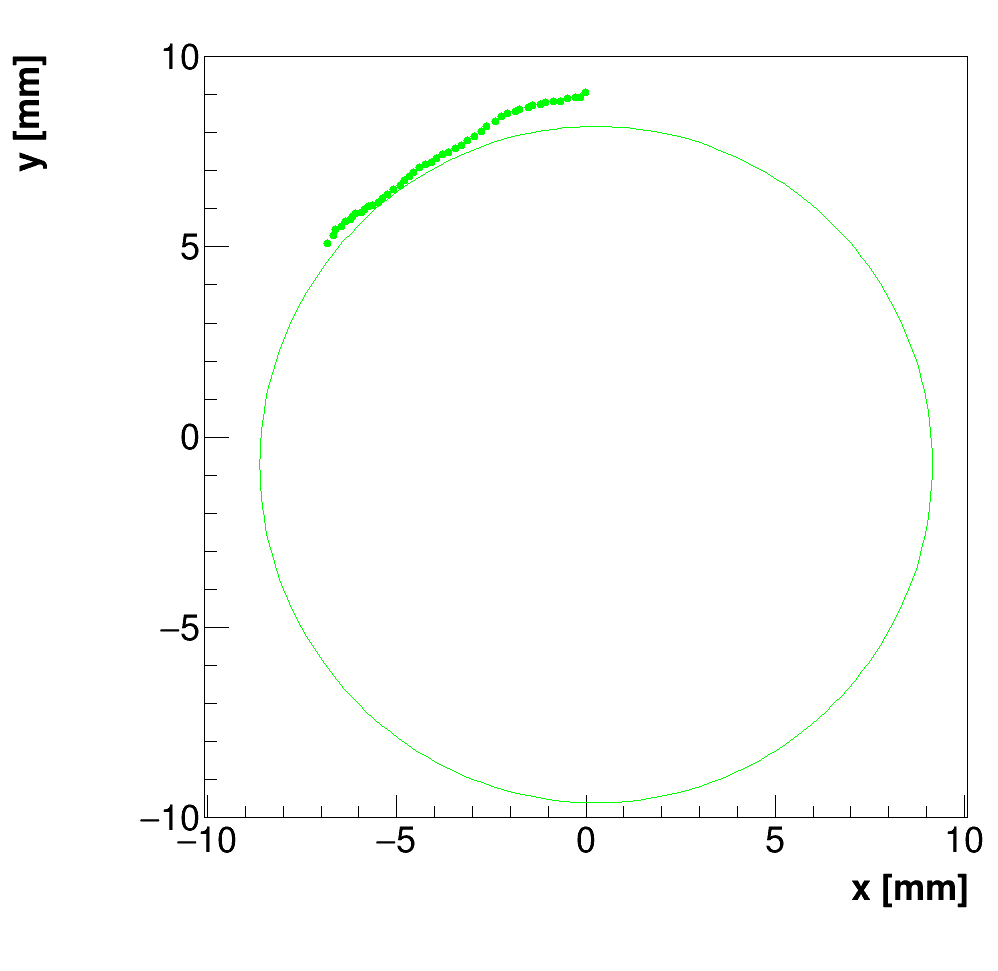
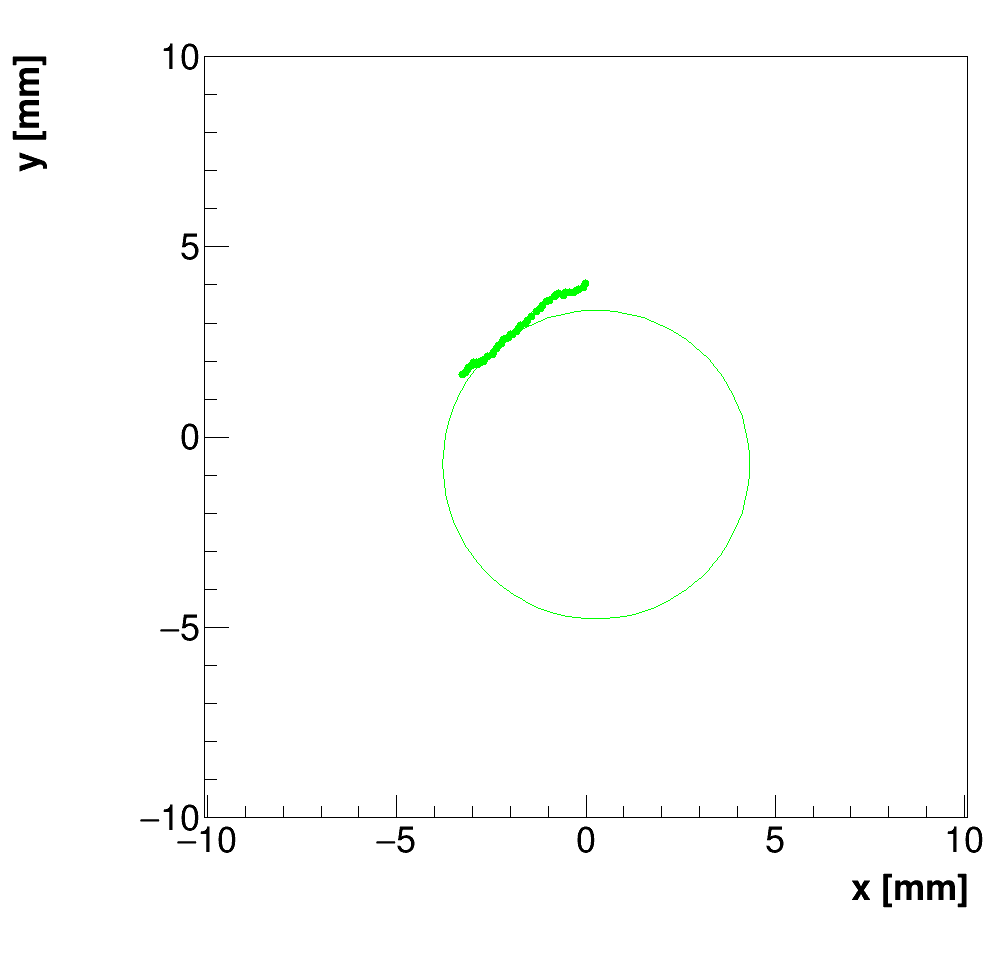
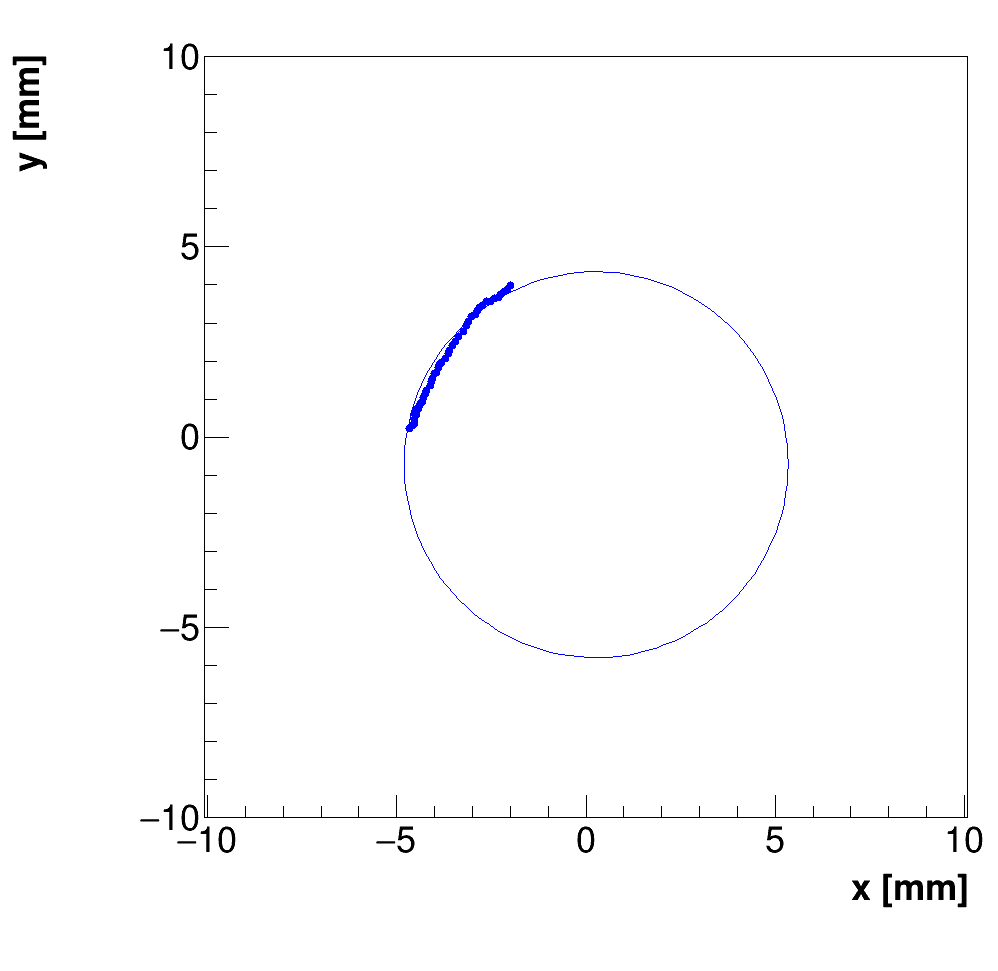
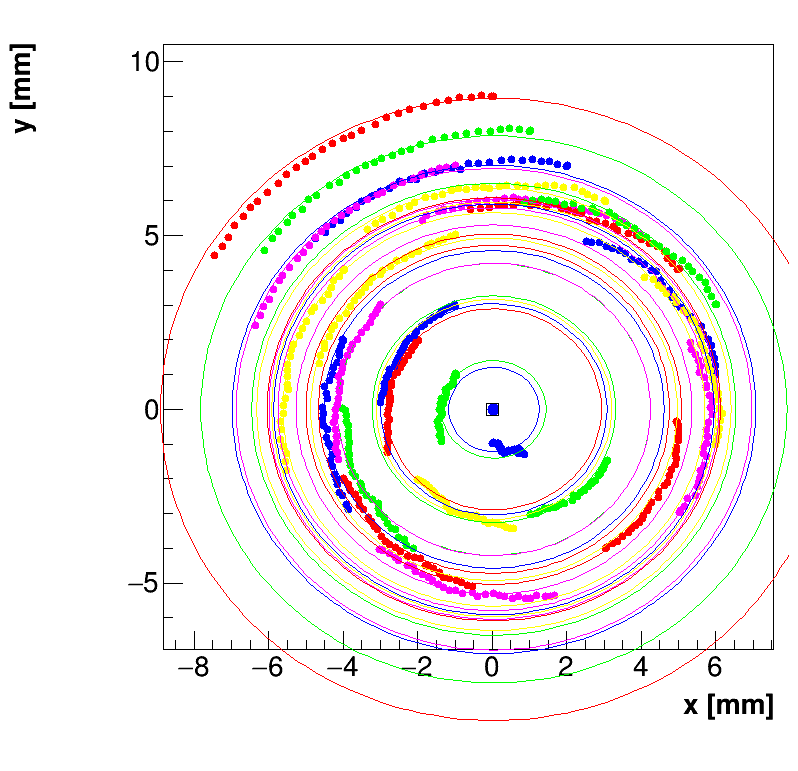
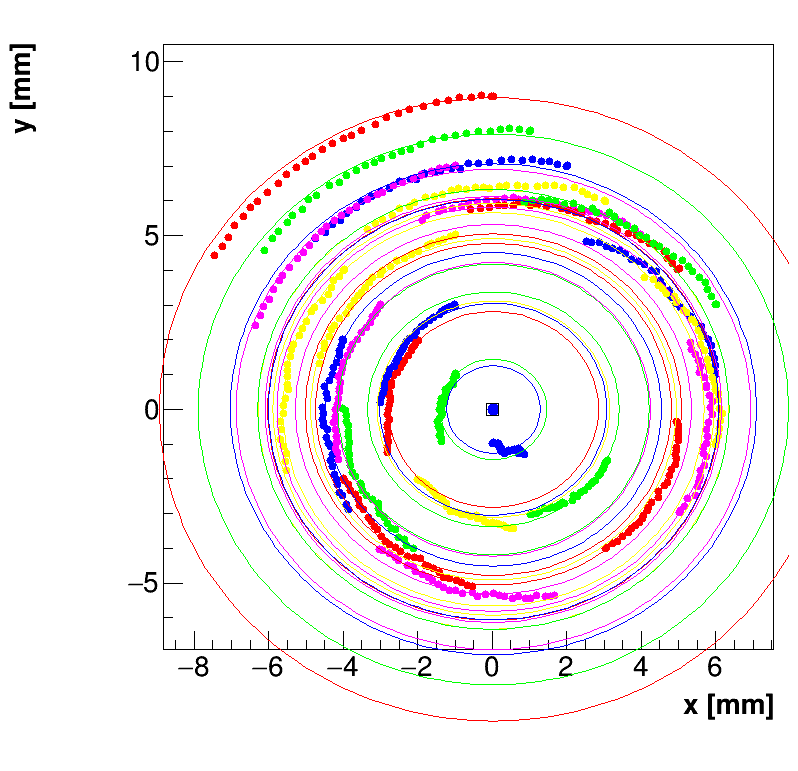
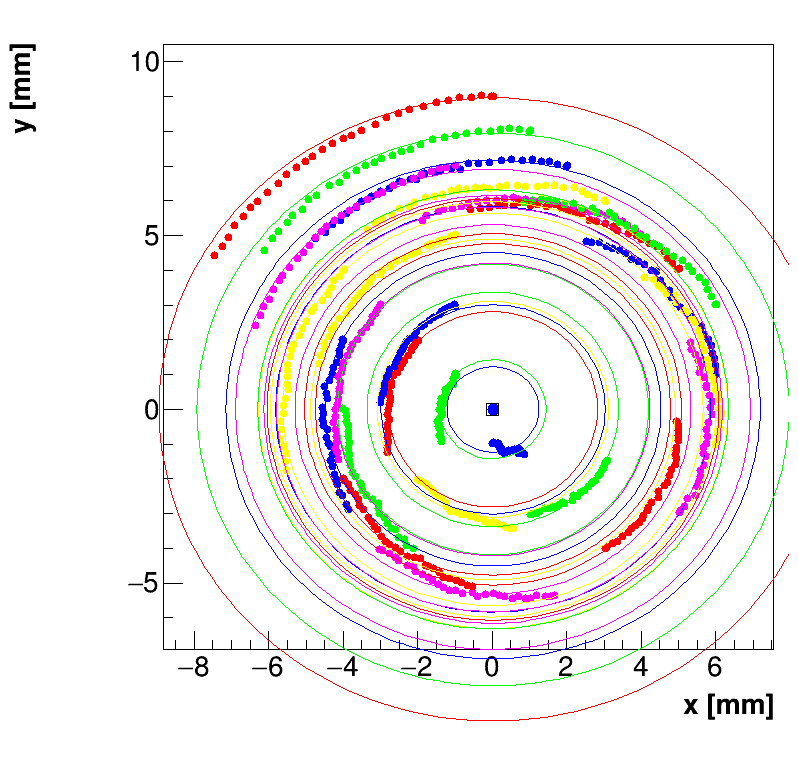
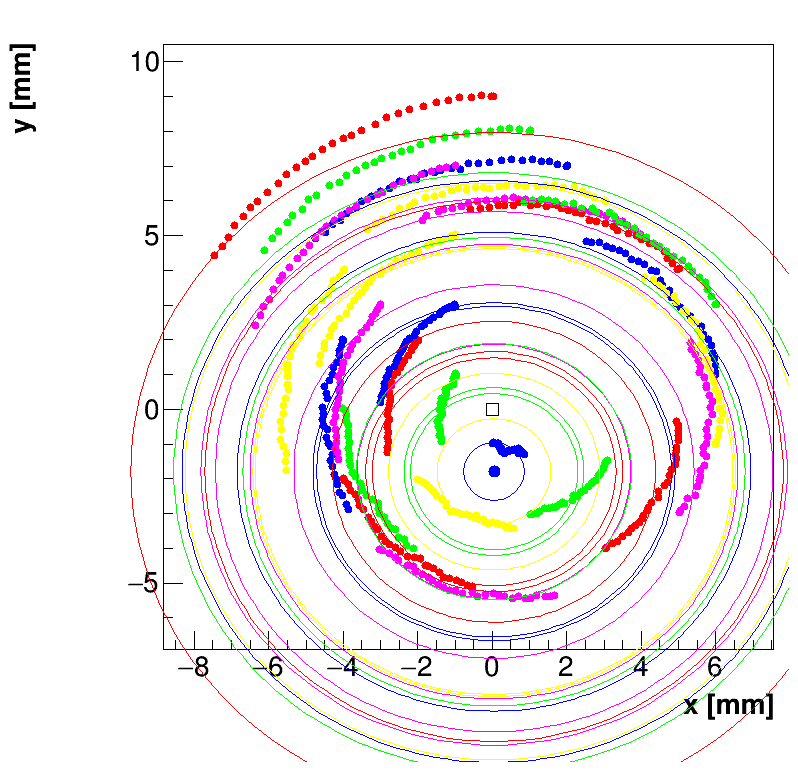
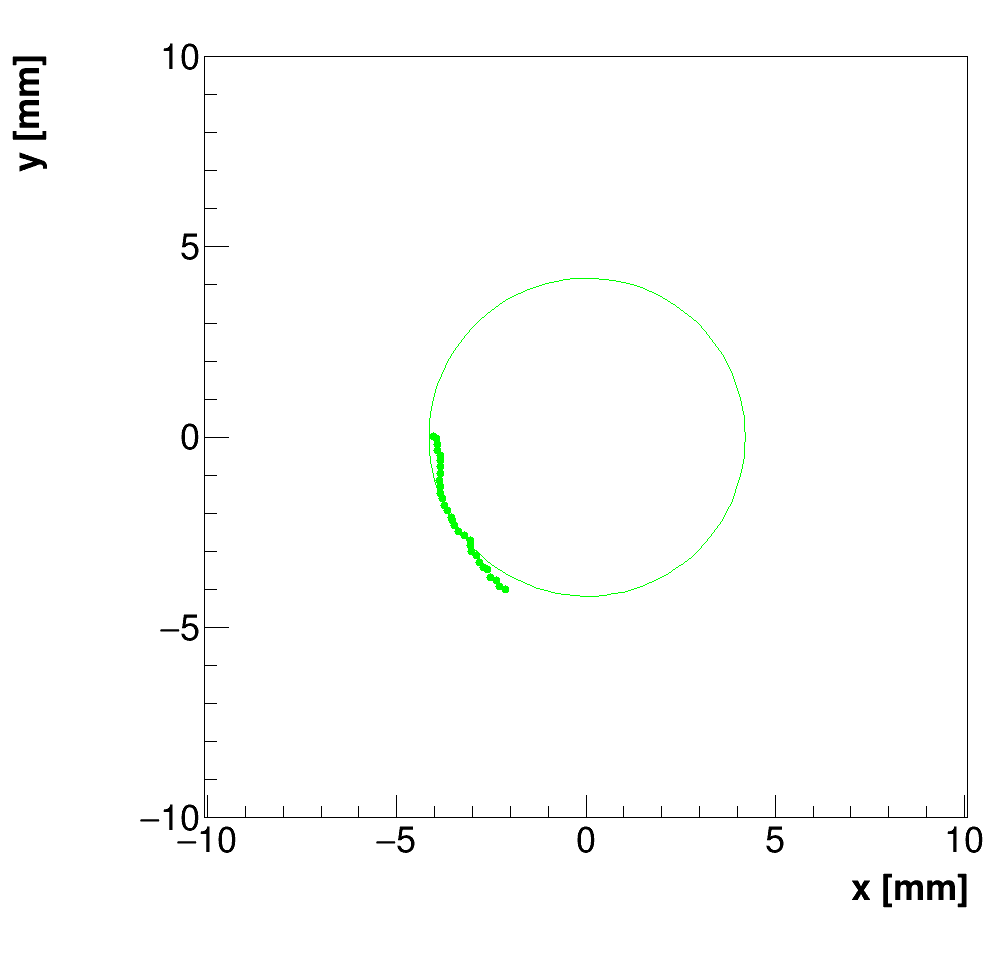
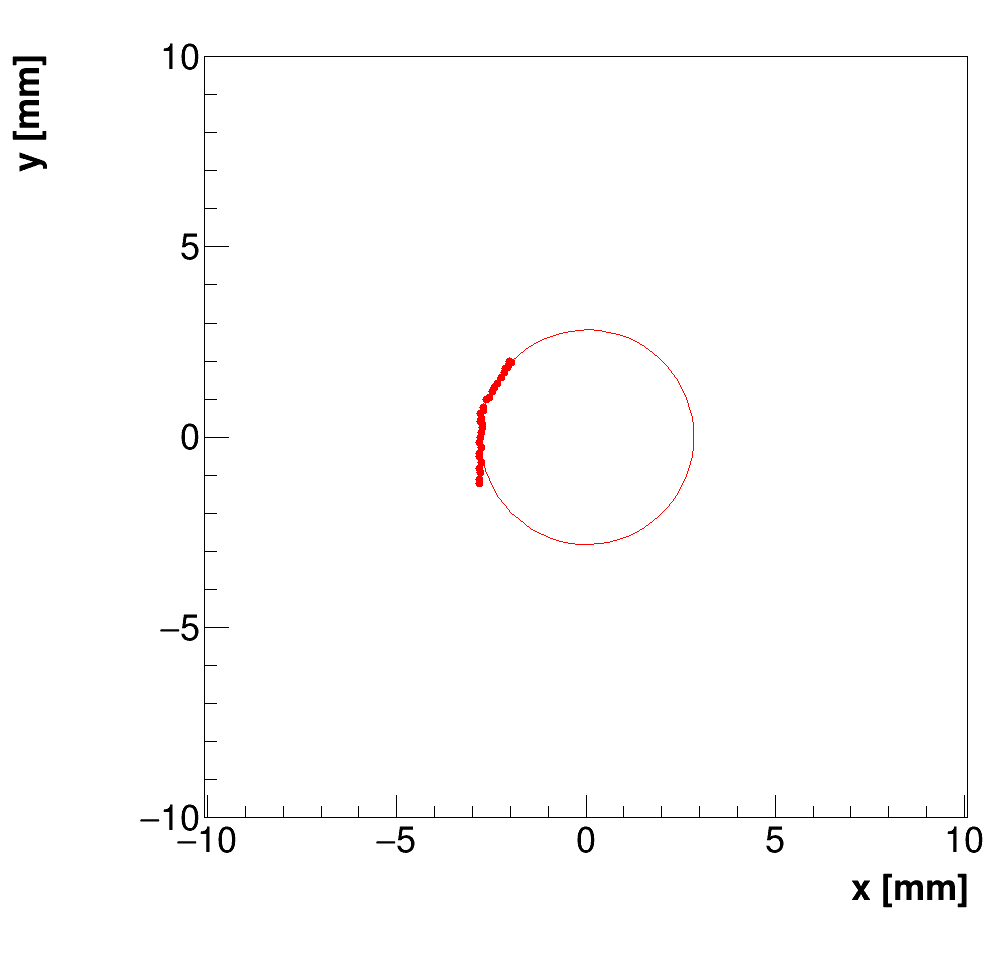
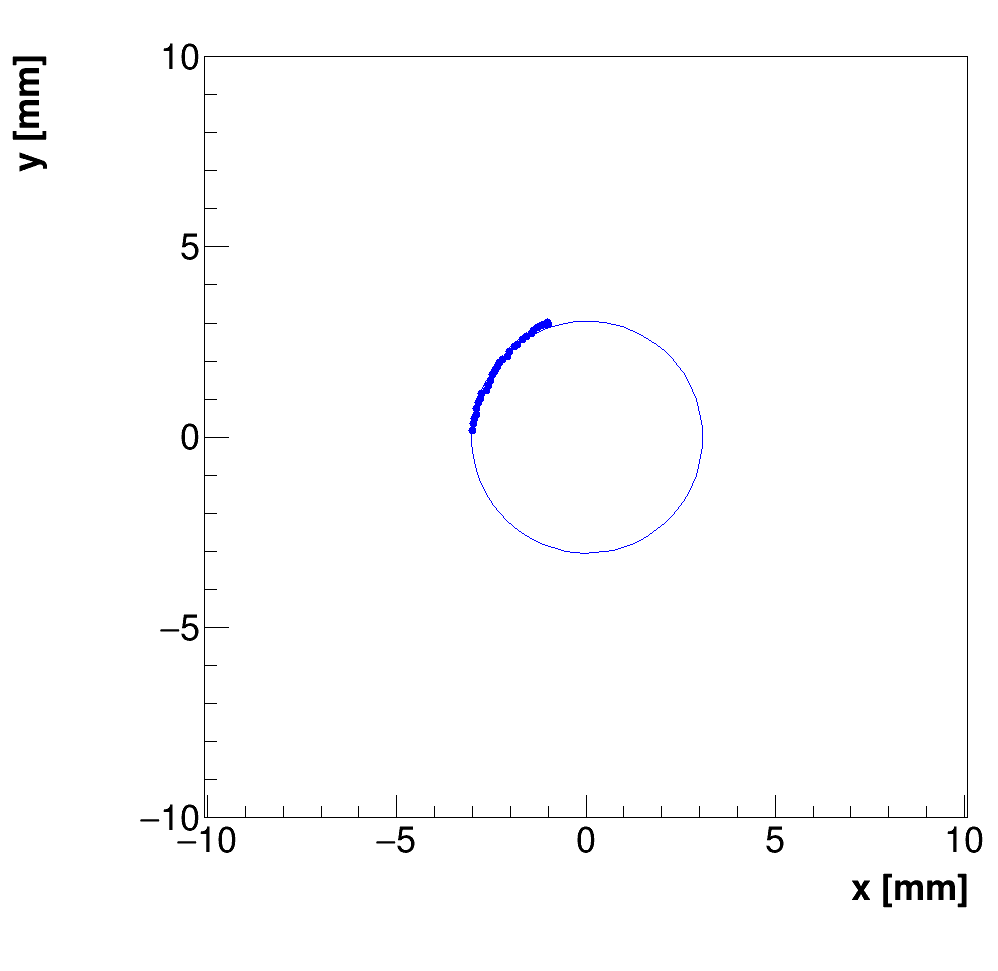
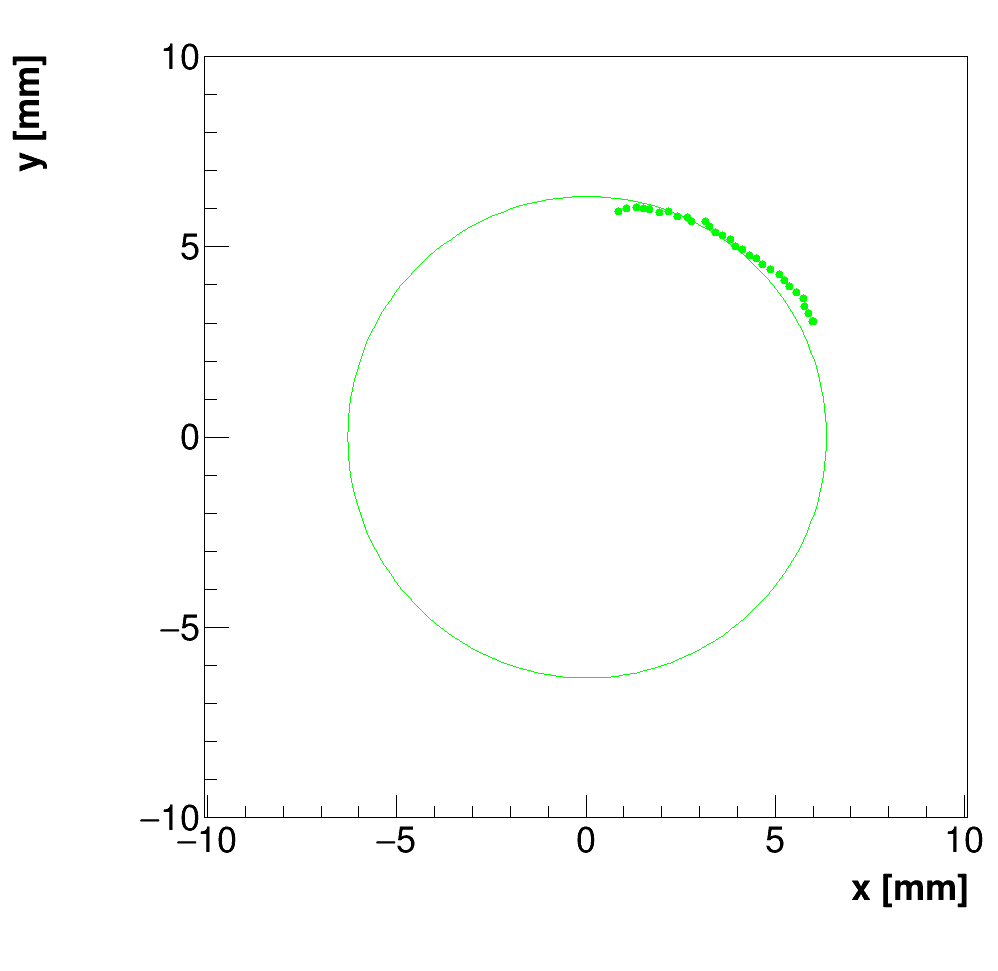
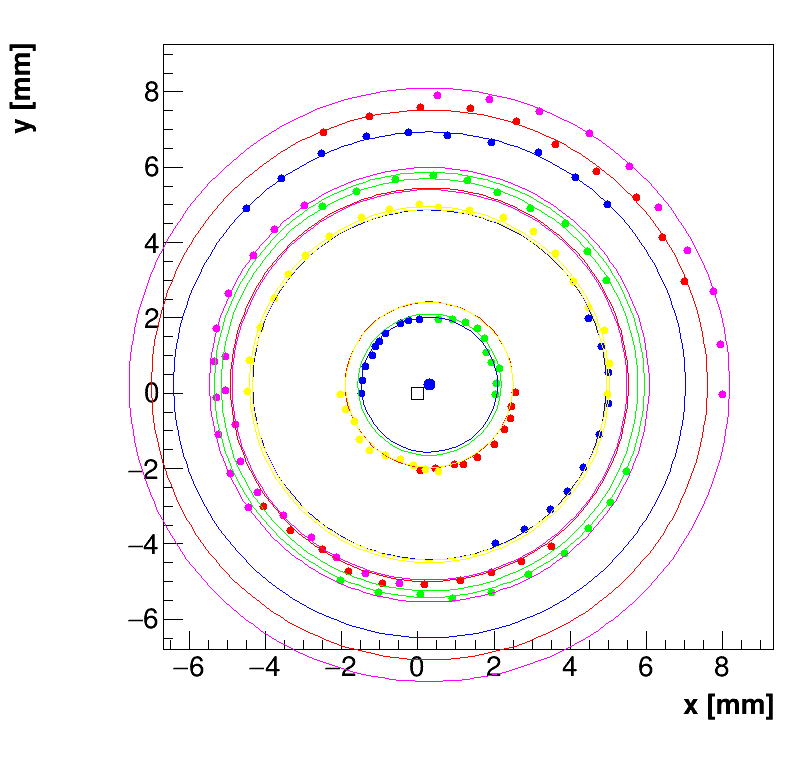
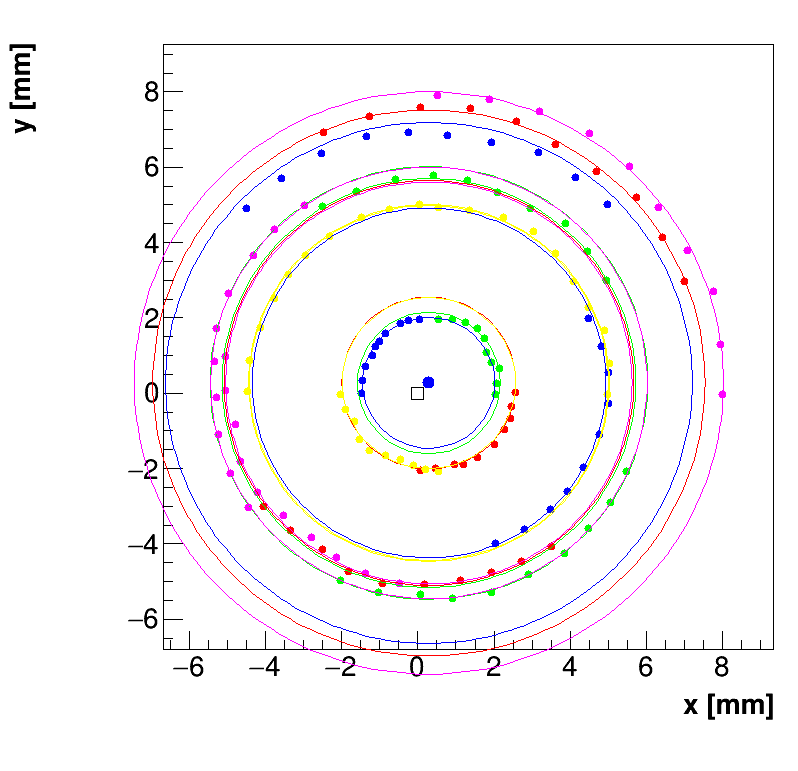
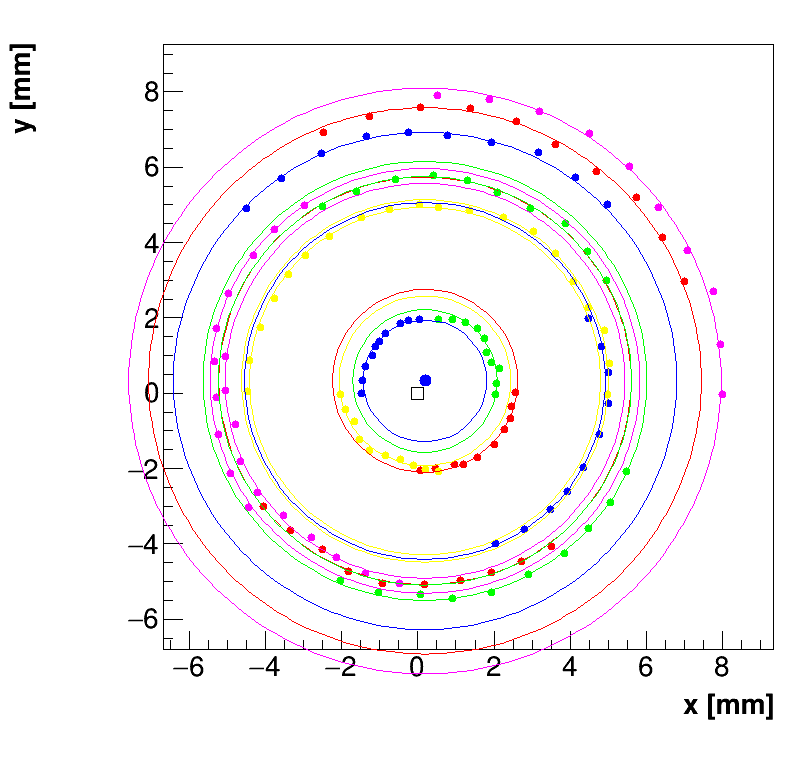
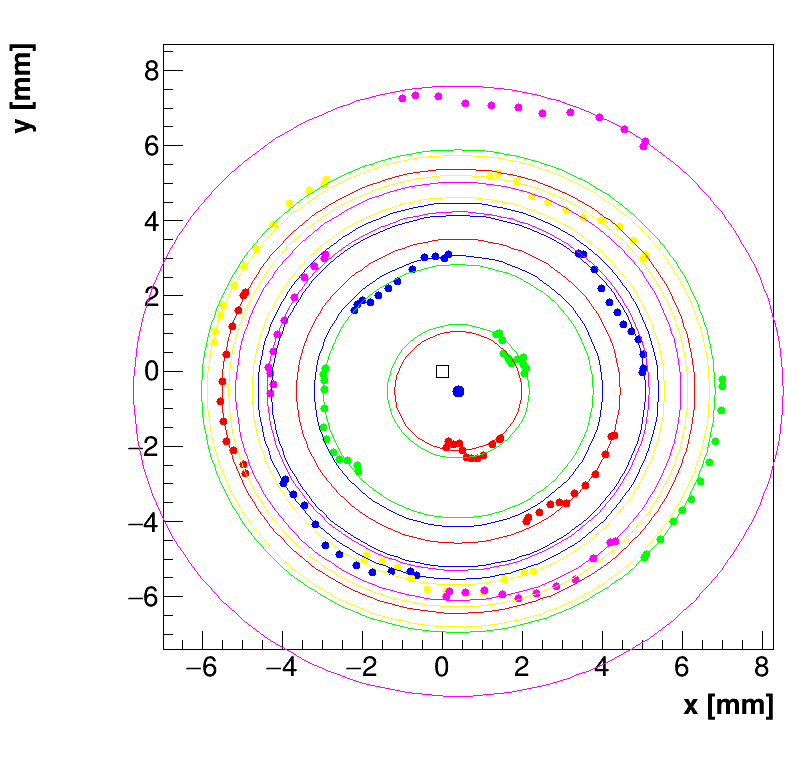
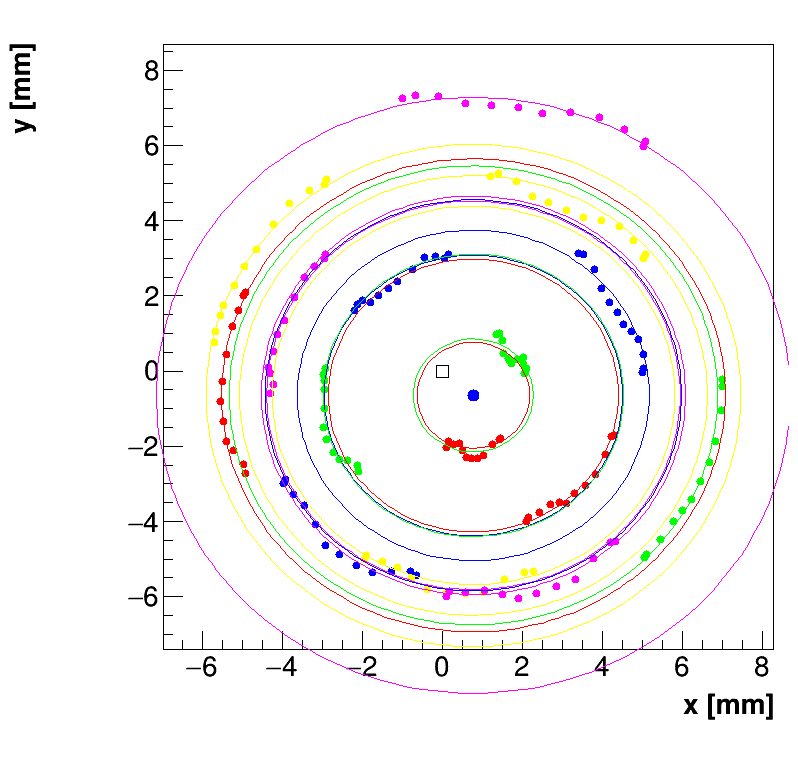
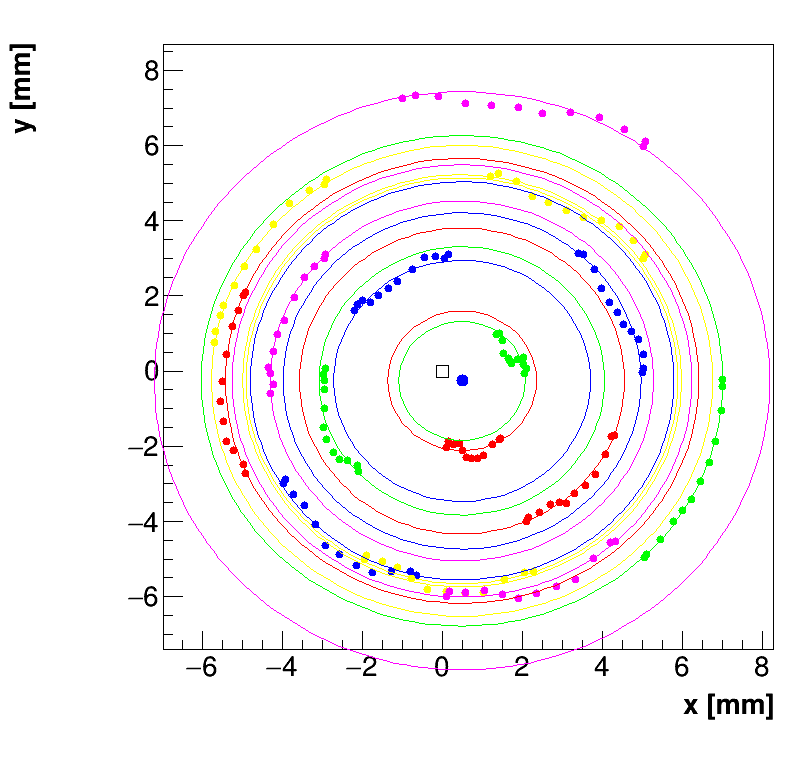
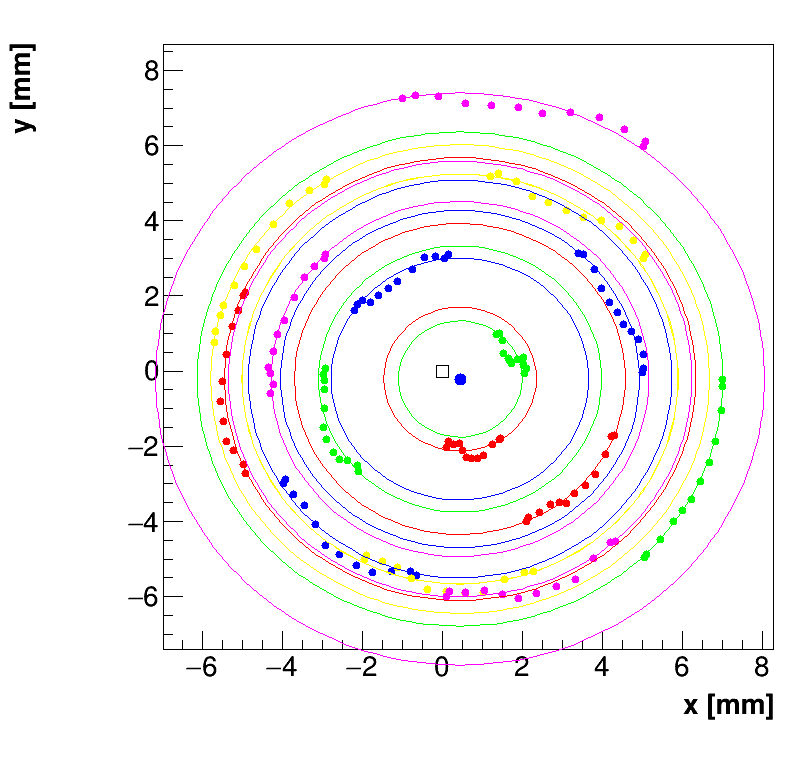
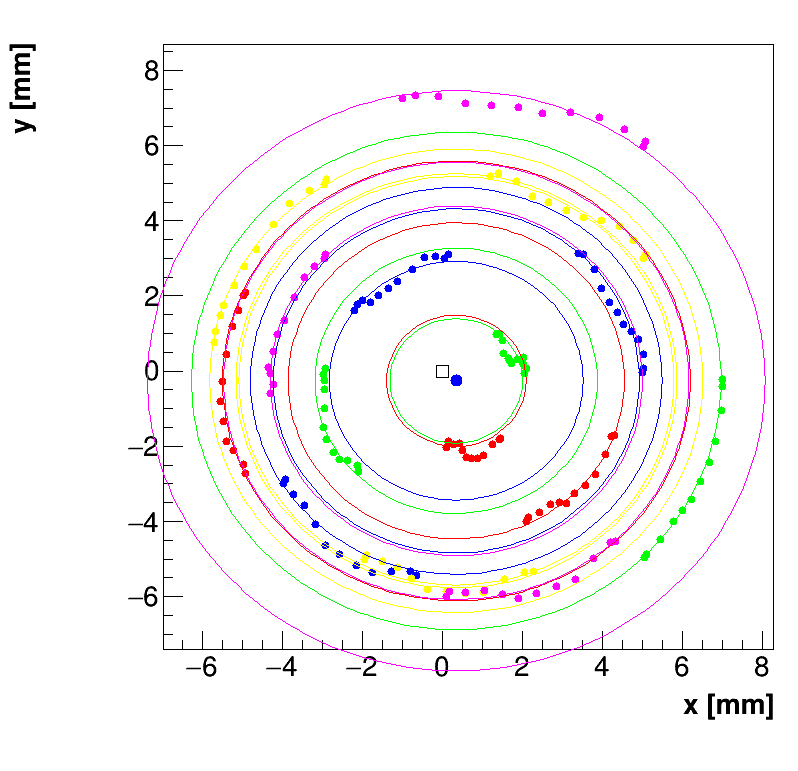
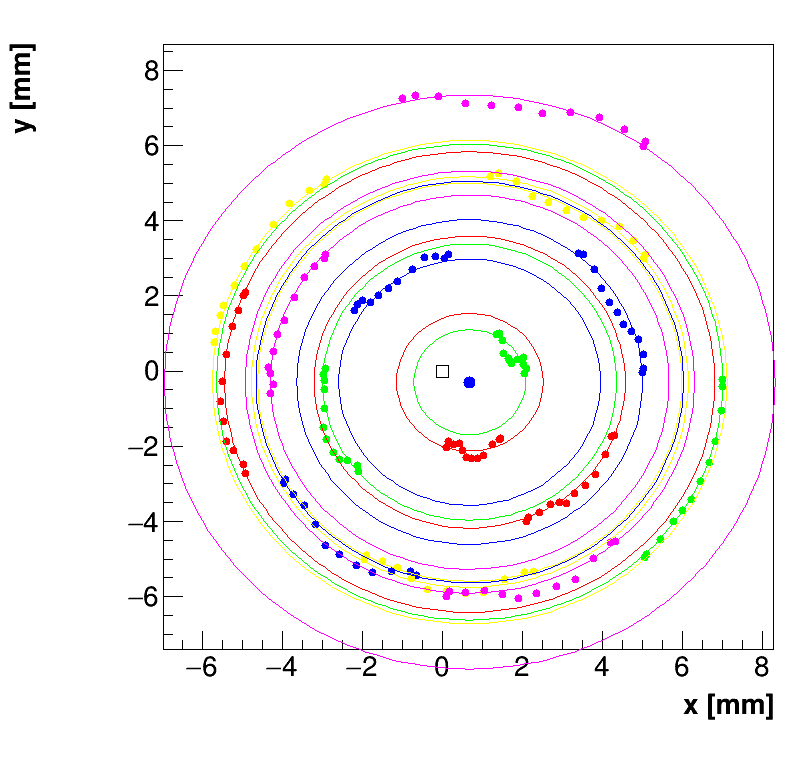
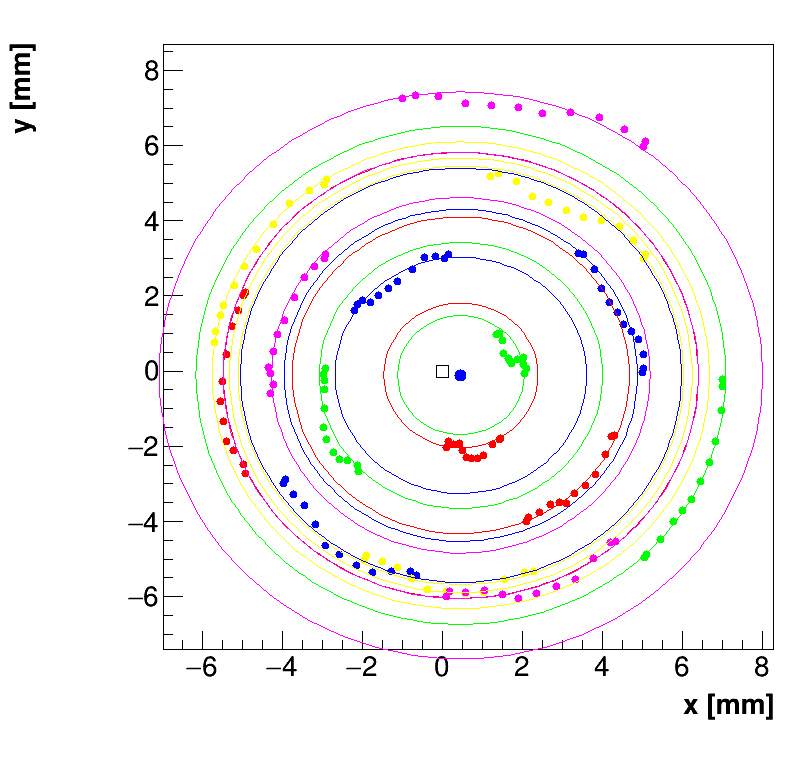
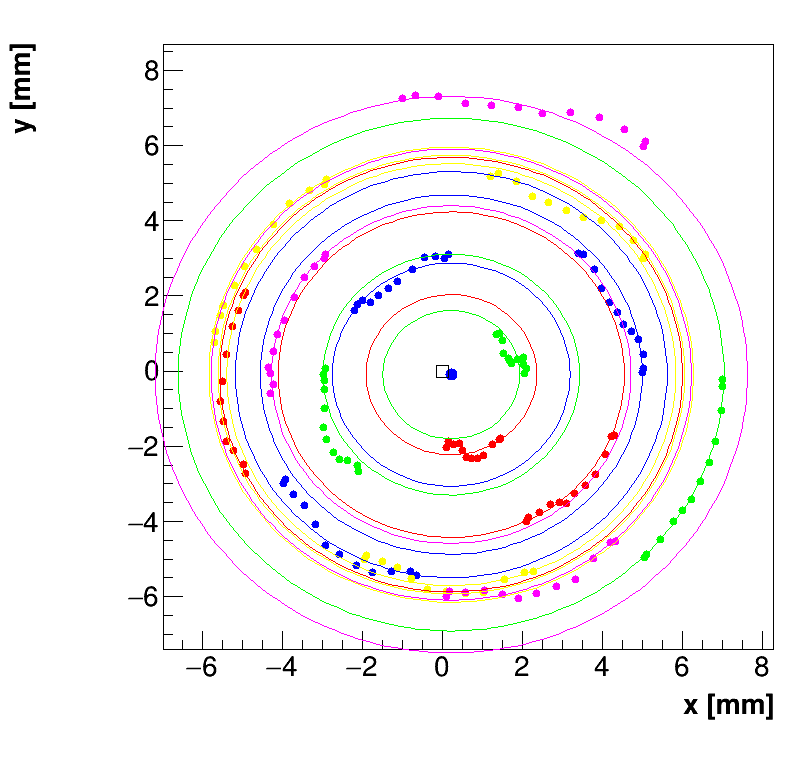
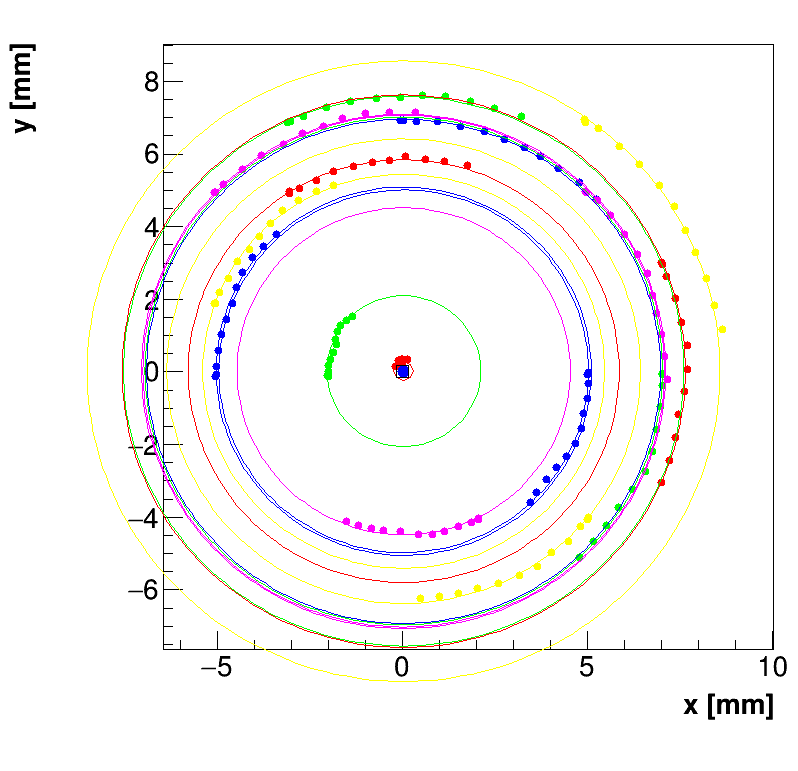
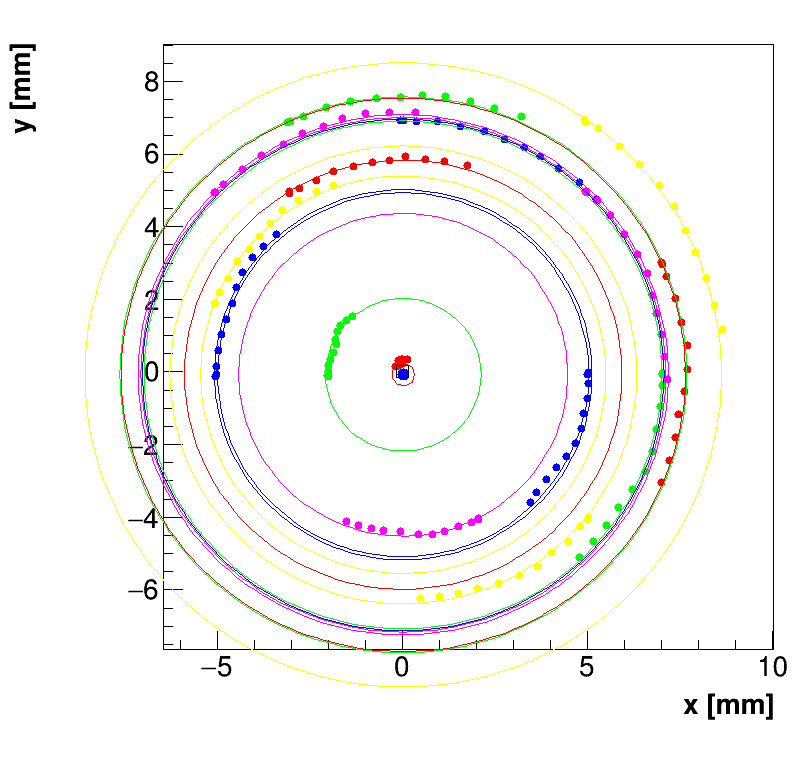
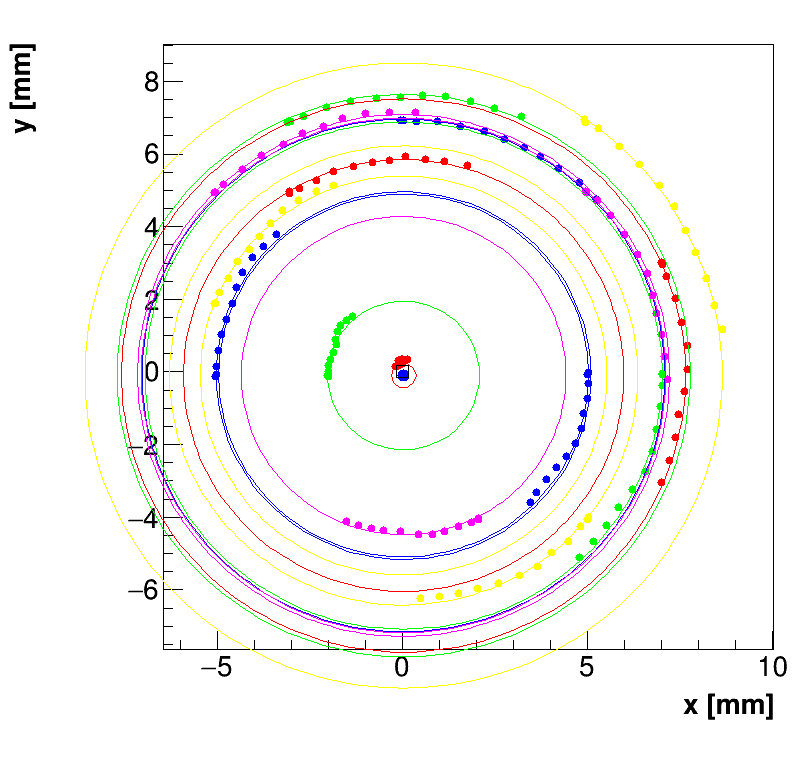
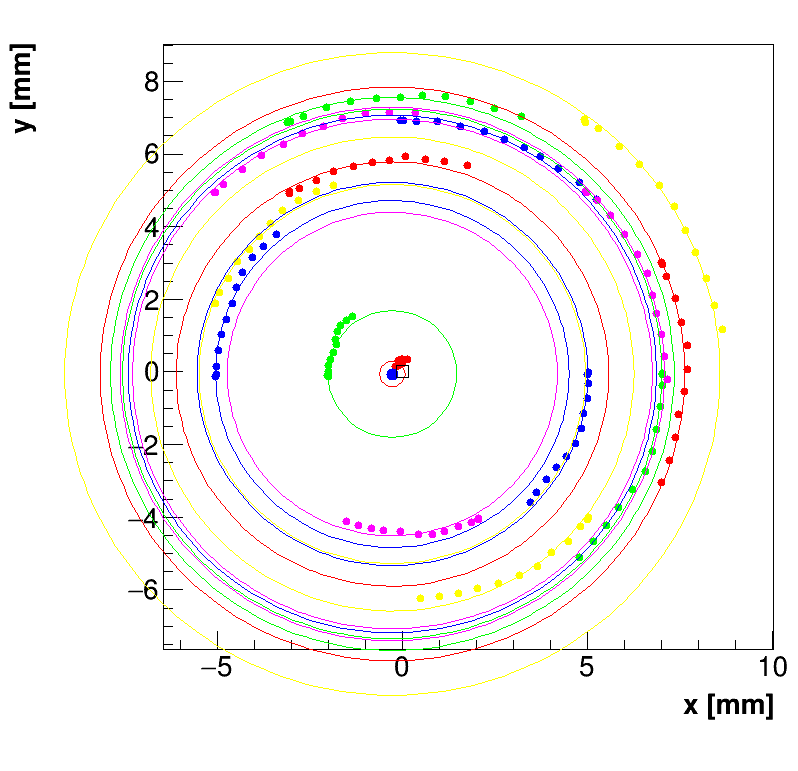
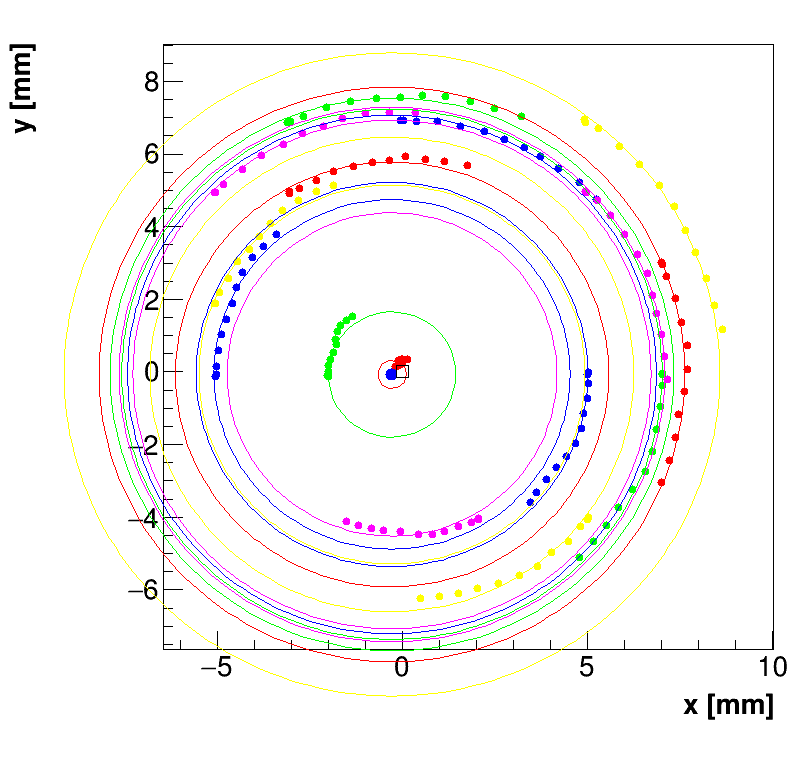
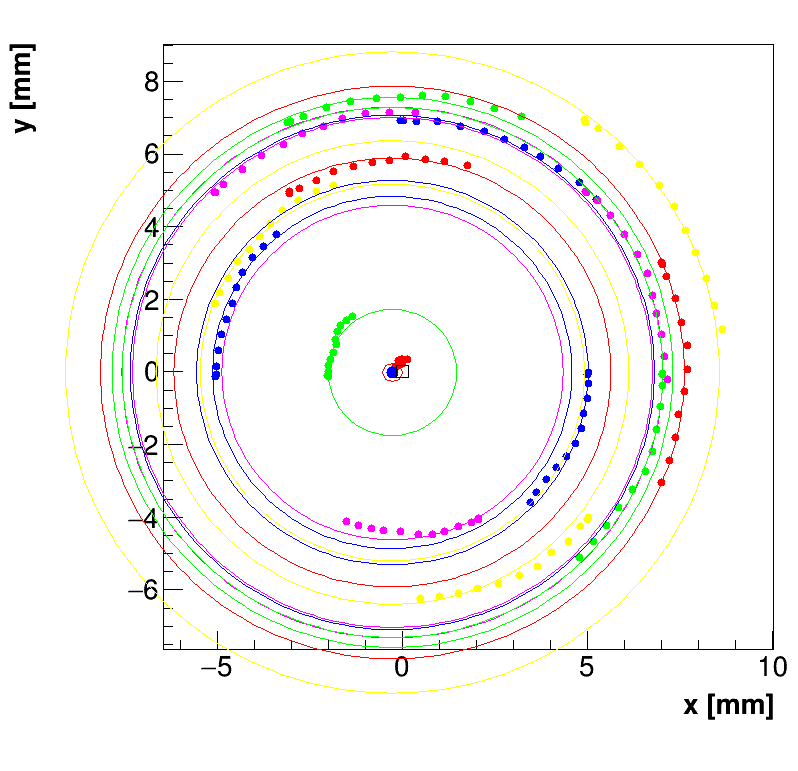
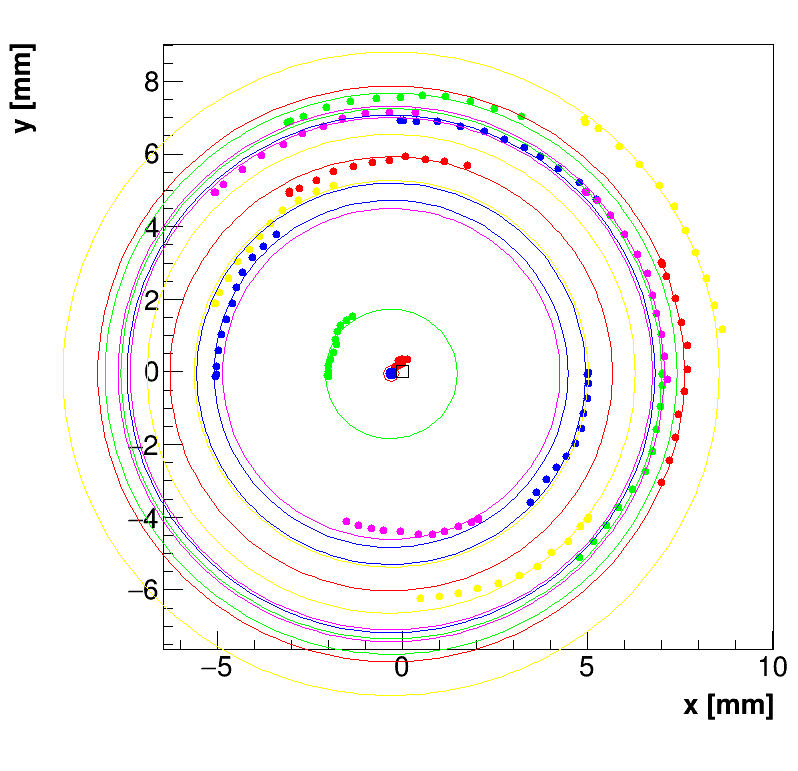
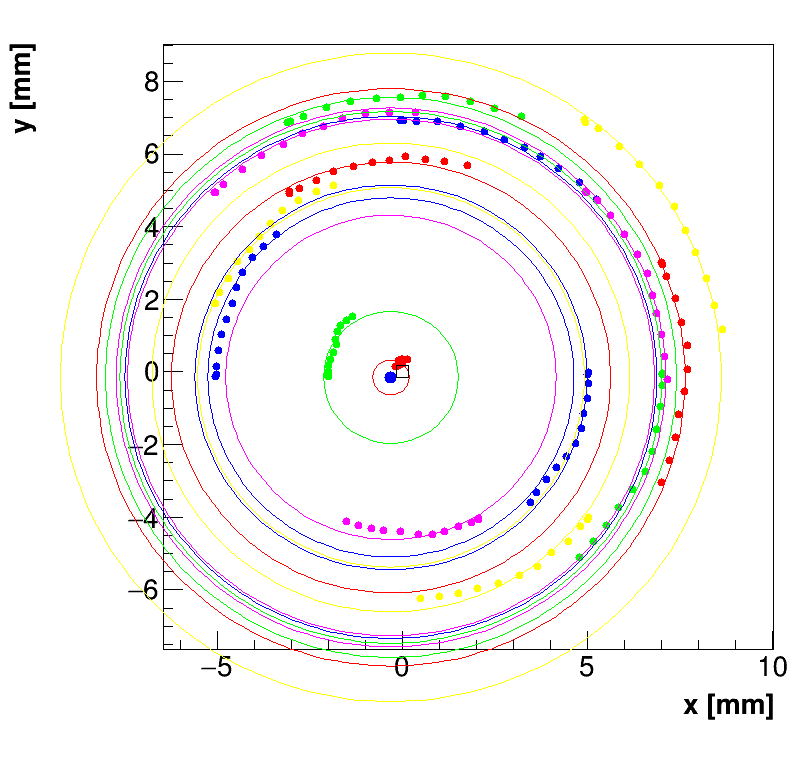
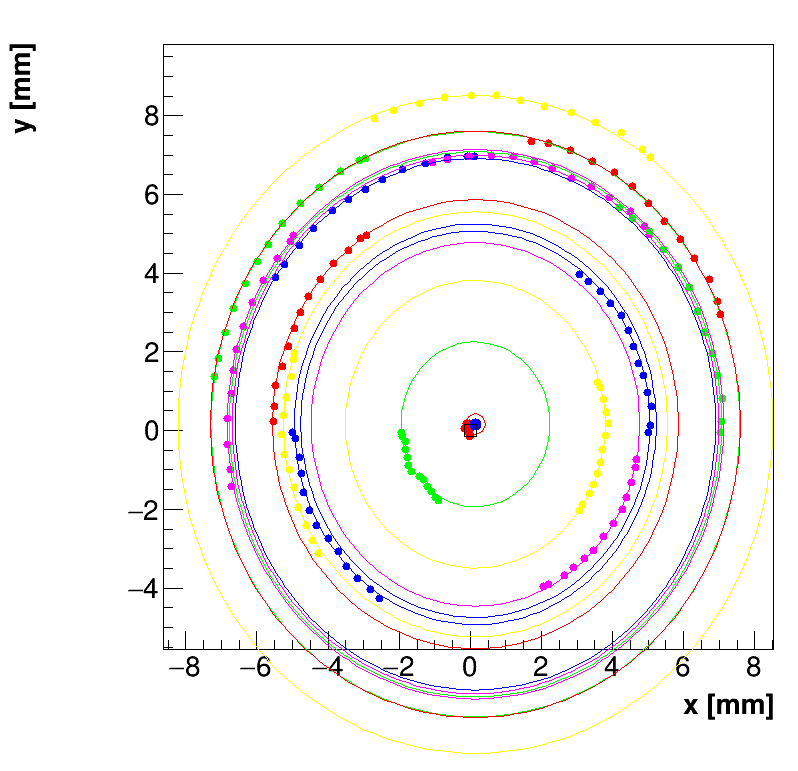
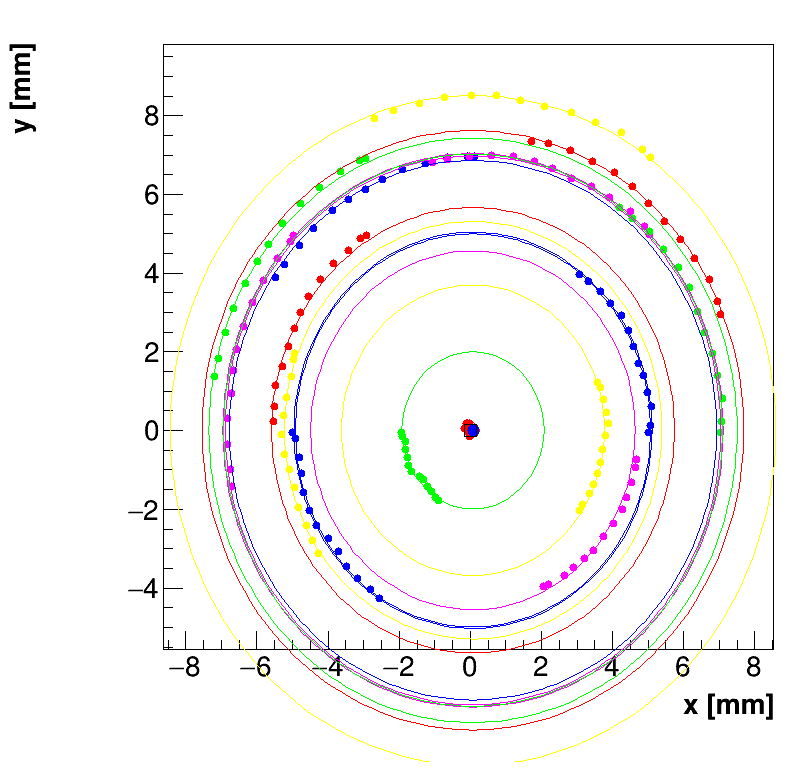
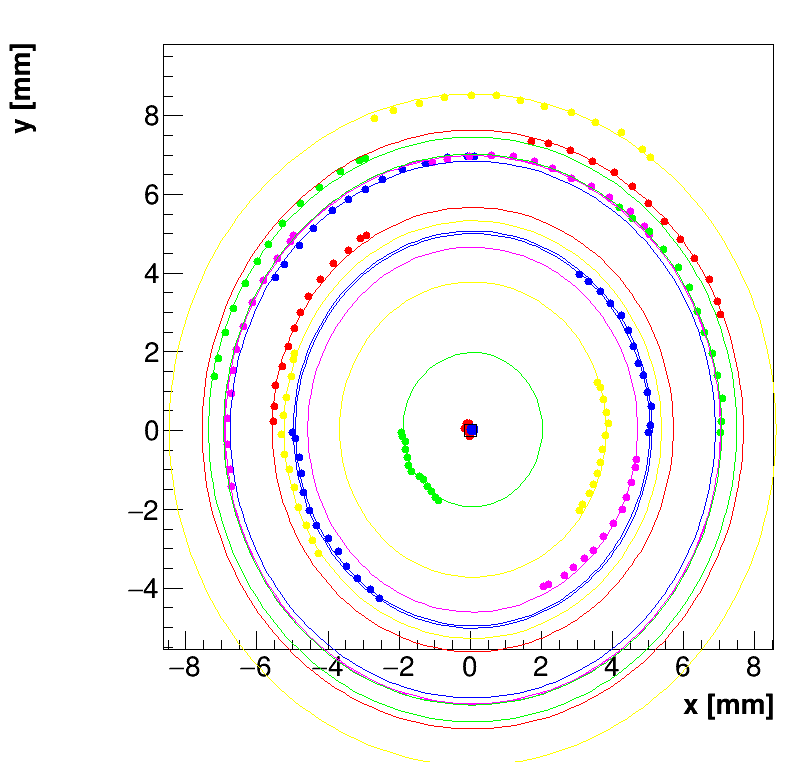
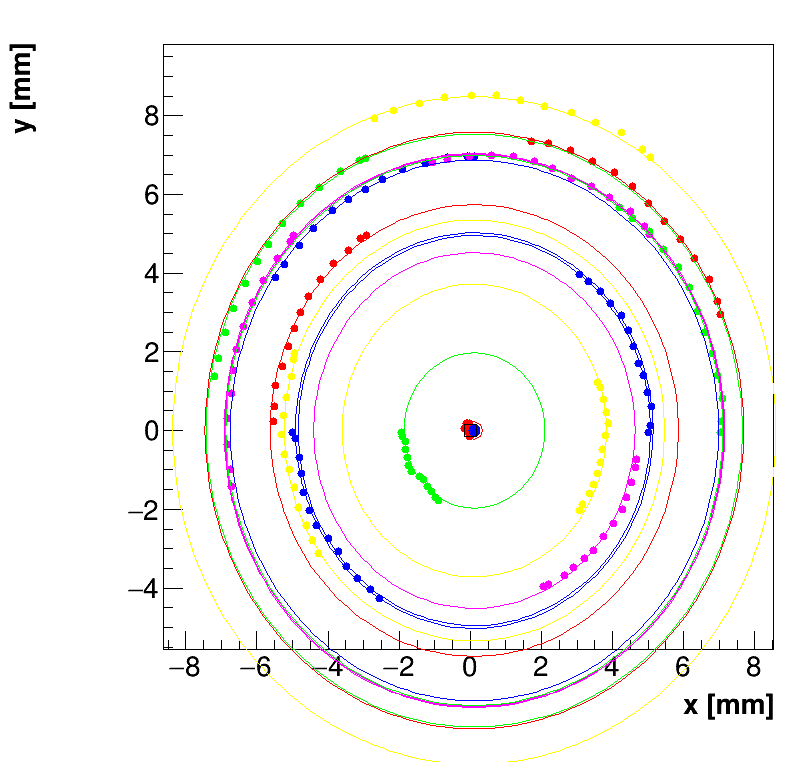
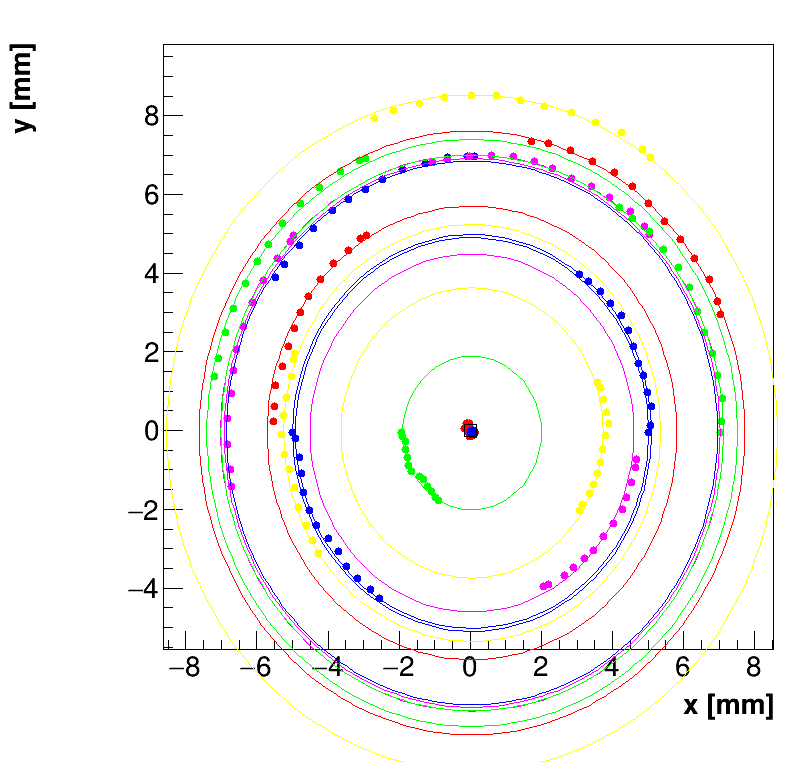
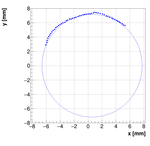
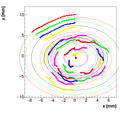
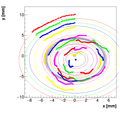
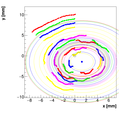
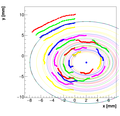
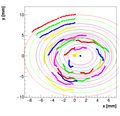
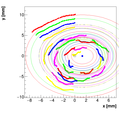
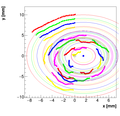
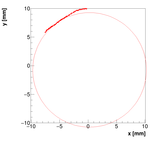
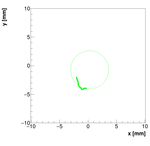
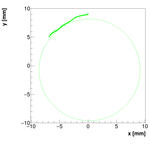
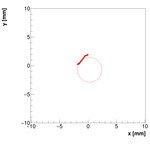
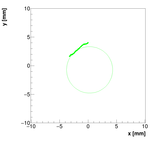
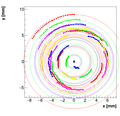
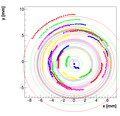
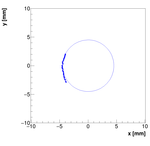
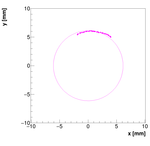
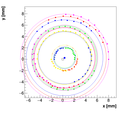
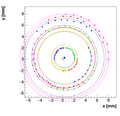
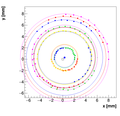
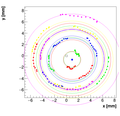
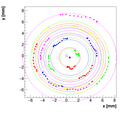
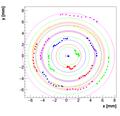
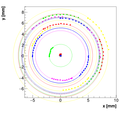
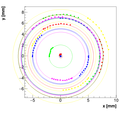
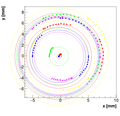
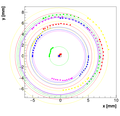
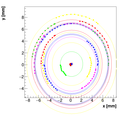
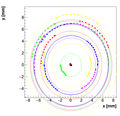
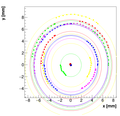
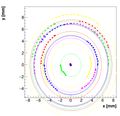
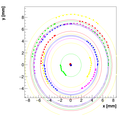
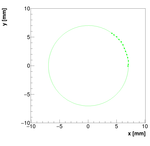
For each spectrometer we inspected approx. 25 points on the map at approx 50 different
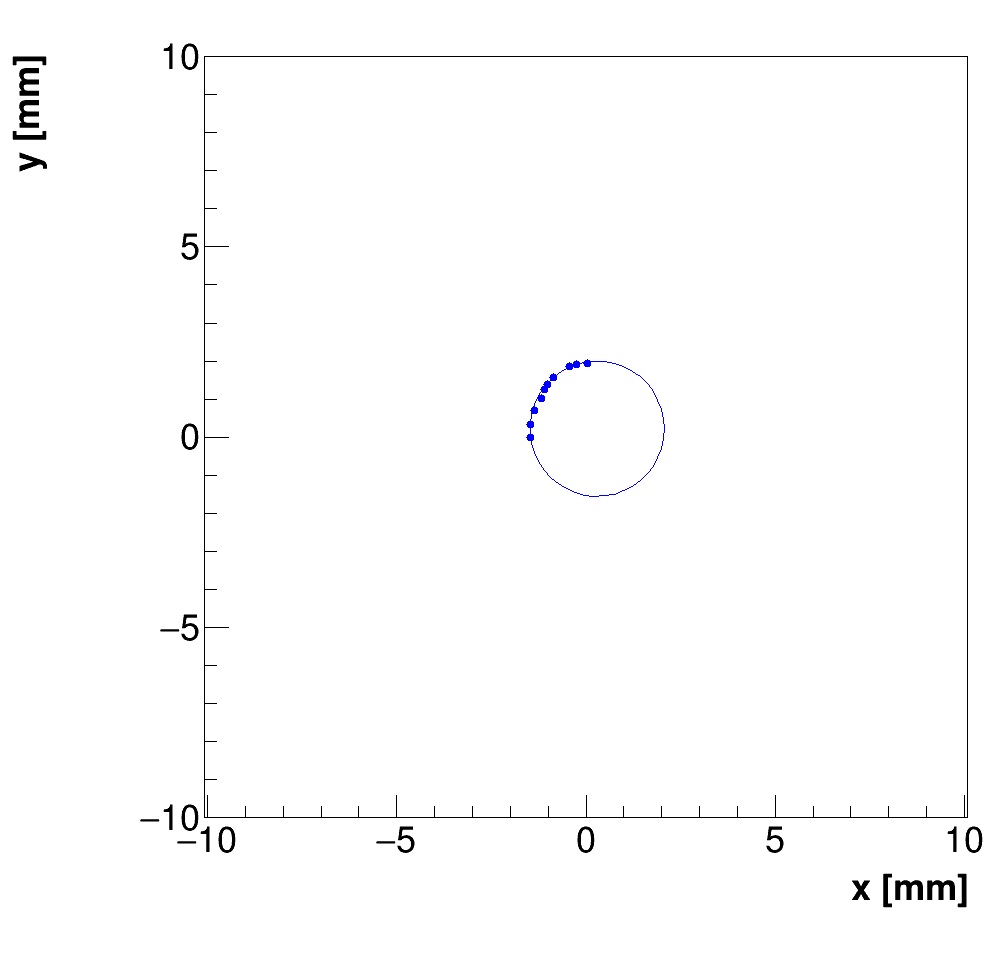
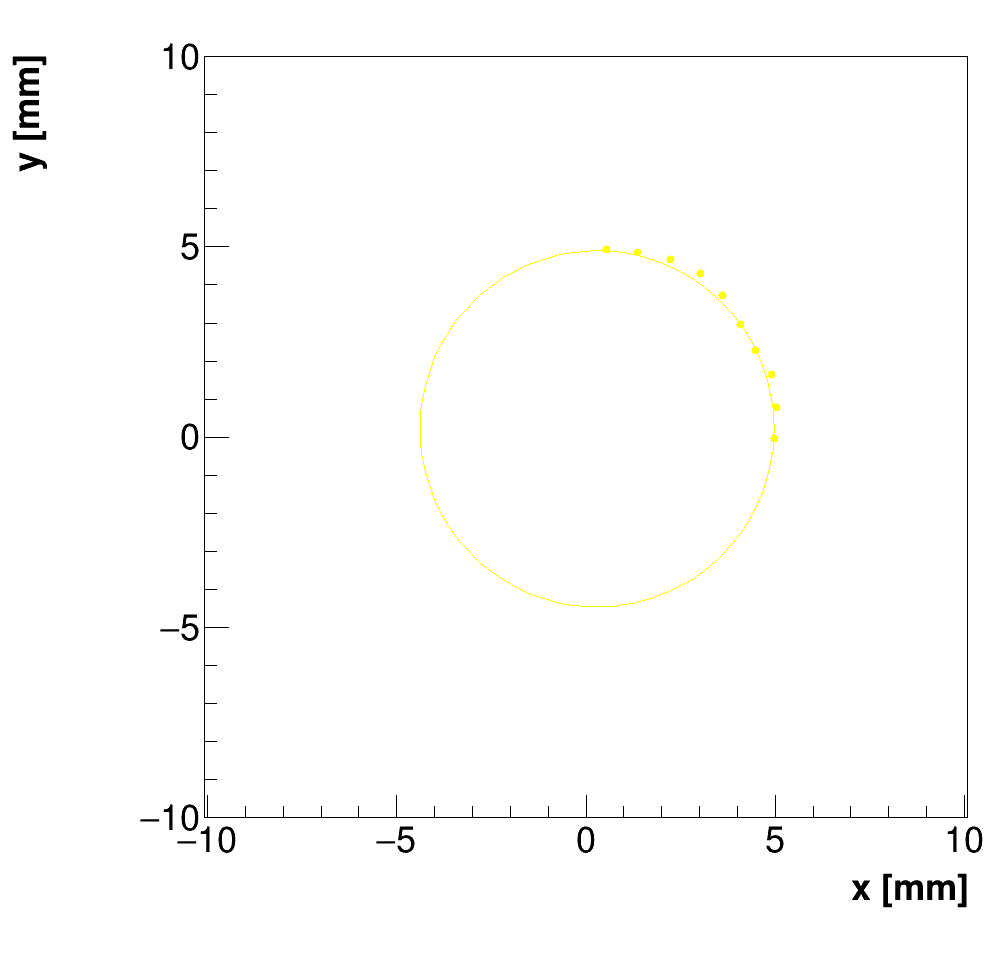
angles, i.e., we have 1250 data points. Then we assume that each points forms a
arc of a circle when rotating a spectrometer. Hence, each arc corresponds to a
circle with a radius Ri and central position (x,y). Using a numerical minimization
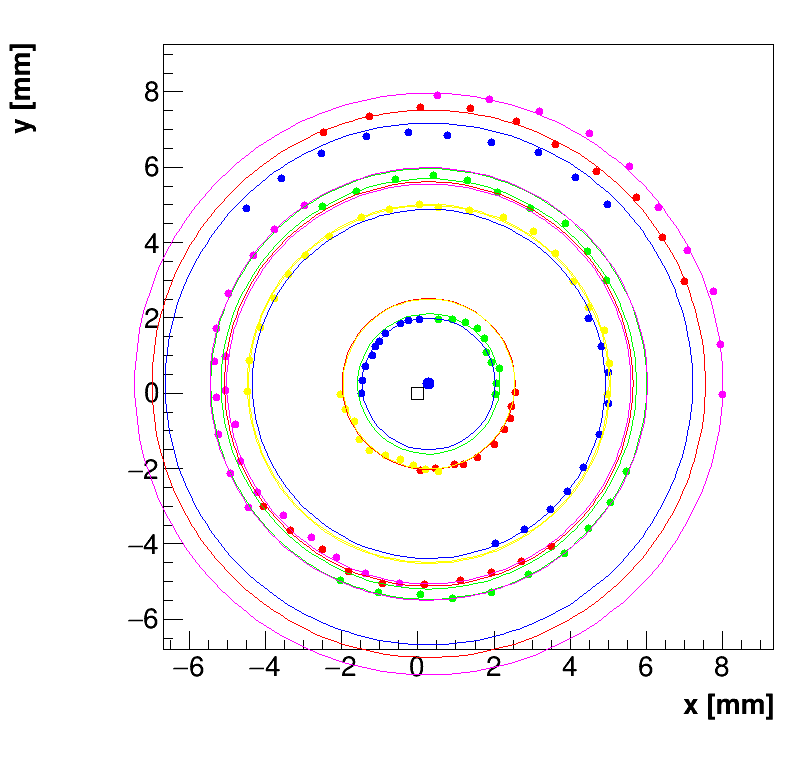
with 25+2 parameters, we try to find solution, where all points lay on 25 circles
with a common central point (x,y), which is a pivot point of a spectrometer.
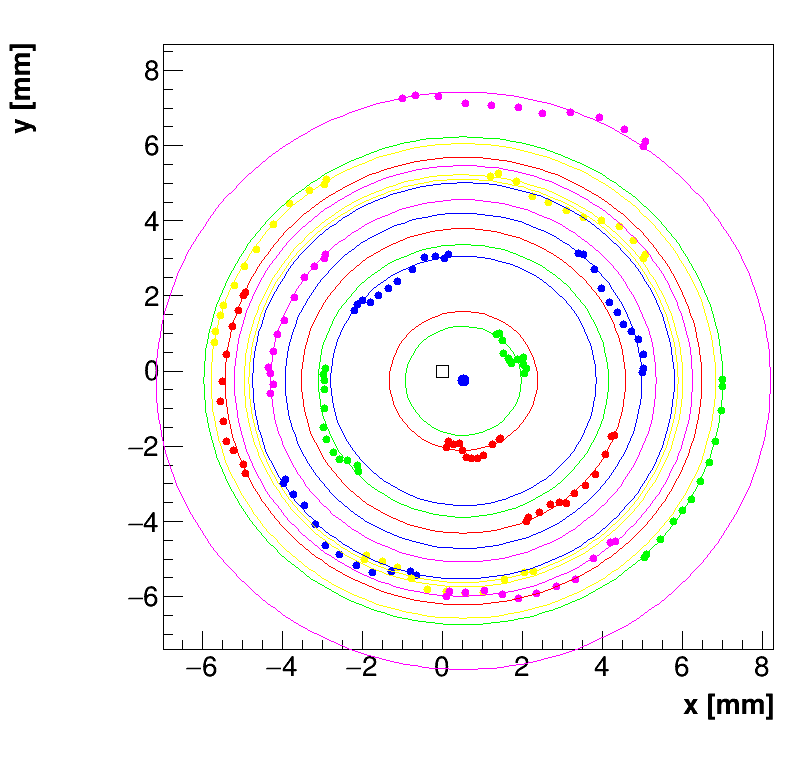
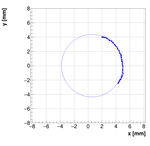
We of course encountered problems. Because the camera was not always perpendicular
to the horizontal plane (or because spectrometers do not move only in horizontal
direction, i.e., the rail is tilted) the points we got do not form an circle but
a more complex structure. Because of this the numerical minimization becomes unstable
and can lead to a local minimum instead to a global one. Therefore, we added
additional constraints to make the problem more robust.
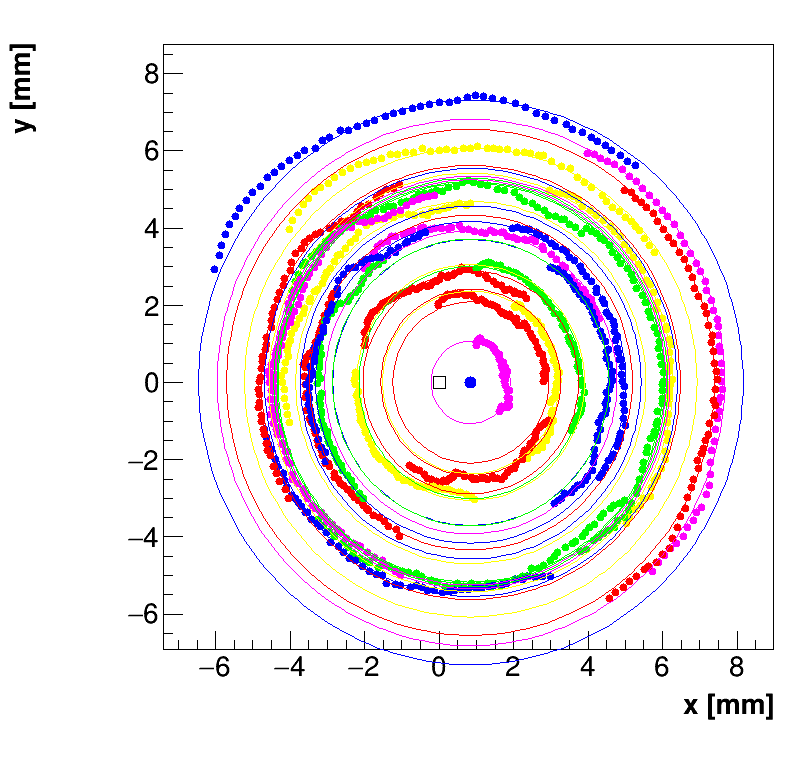
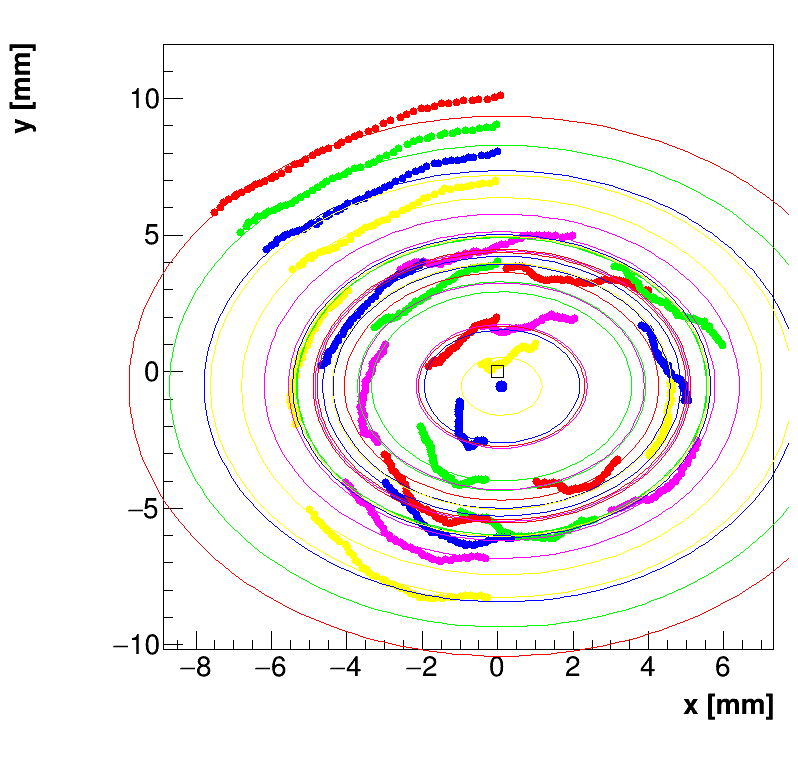
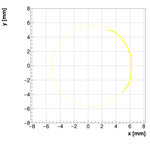
We demanded that angle between two inspected points on the arc, with respect to
the center (x,y), must agree with angle for which we moved spectrometer.
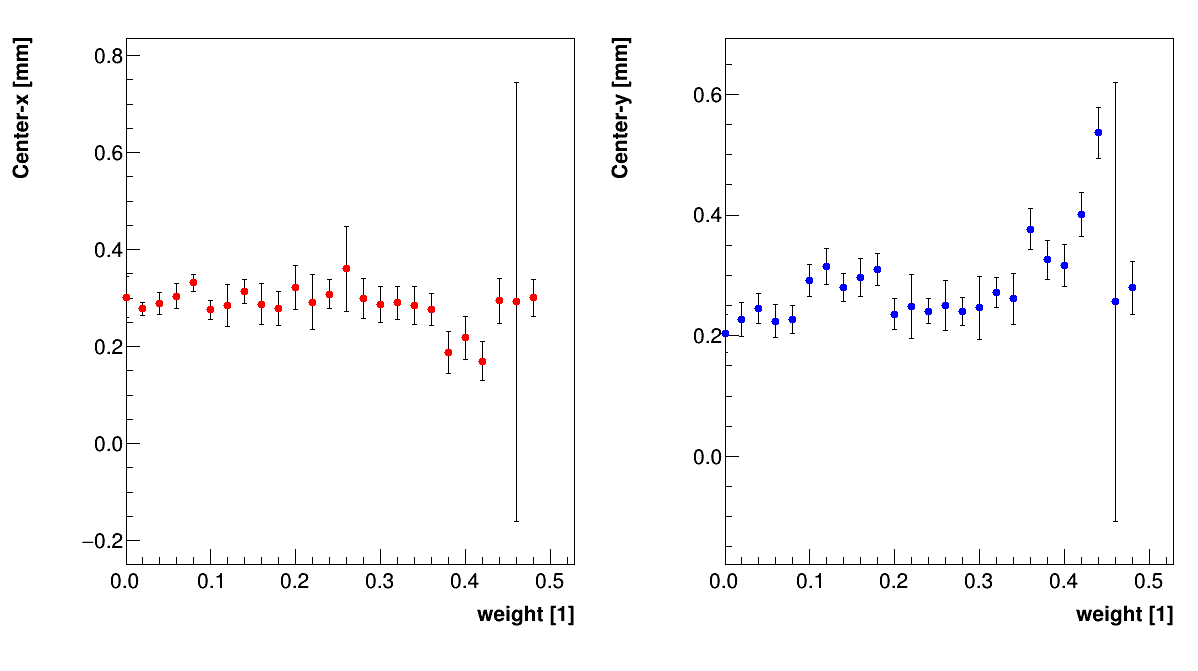
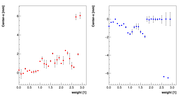
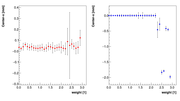
Each constraint is equipped with a Lagrange multiplier (weight) w, which determines
the relevance of each term.
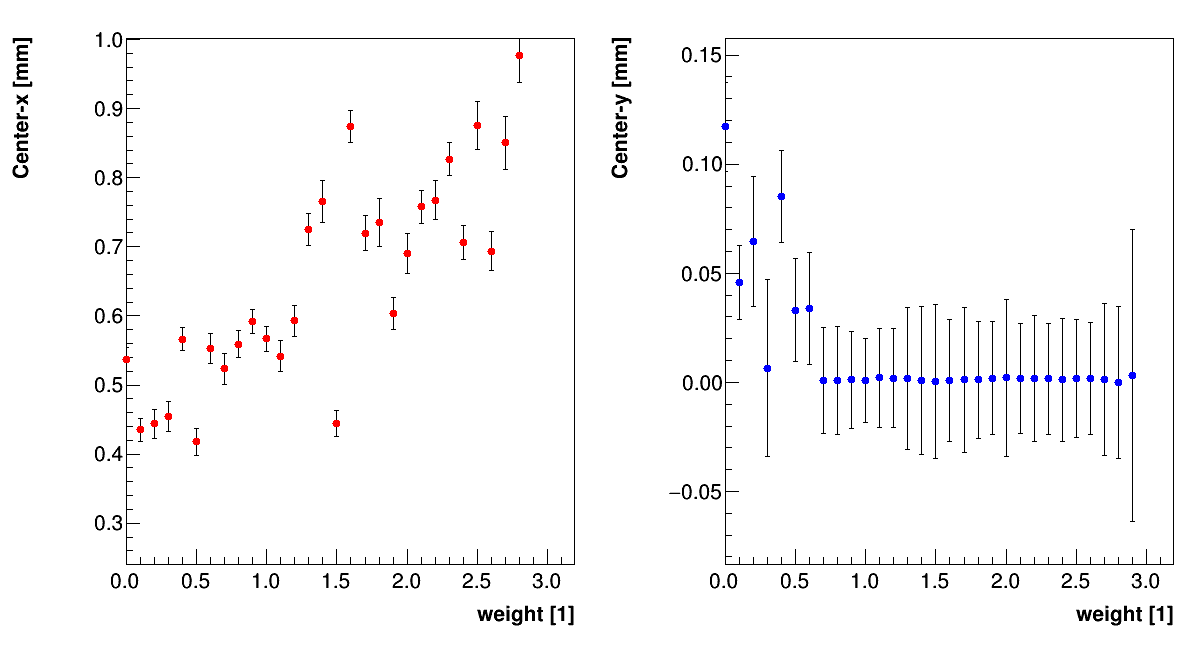
We then investigated how the solution (x,y) changes with "w" and then
selected a value, where the solution seemed to be independent of w, ie, solution
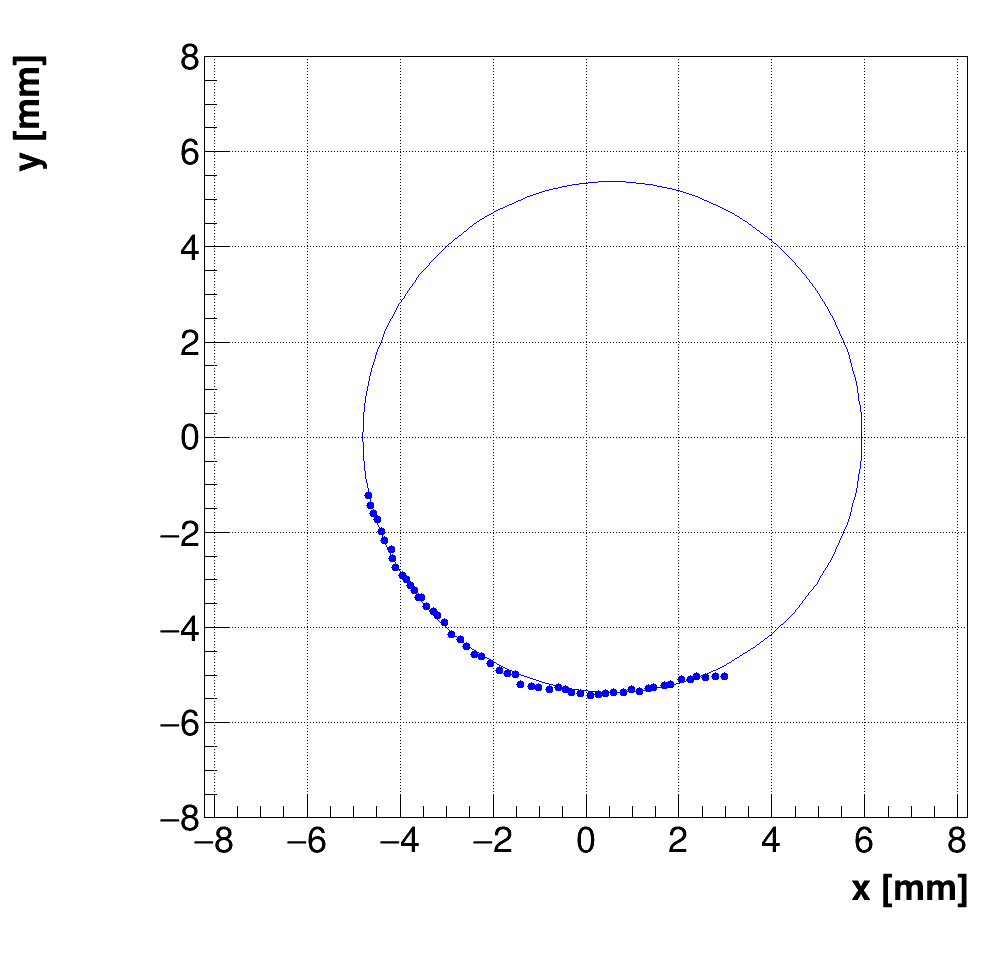
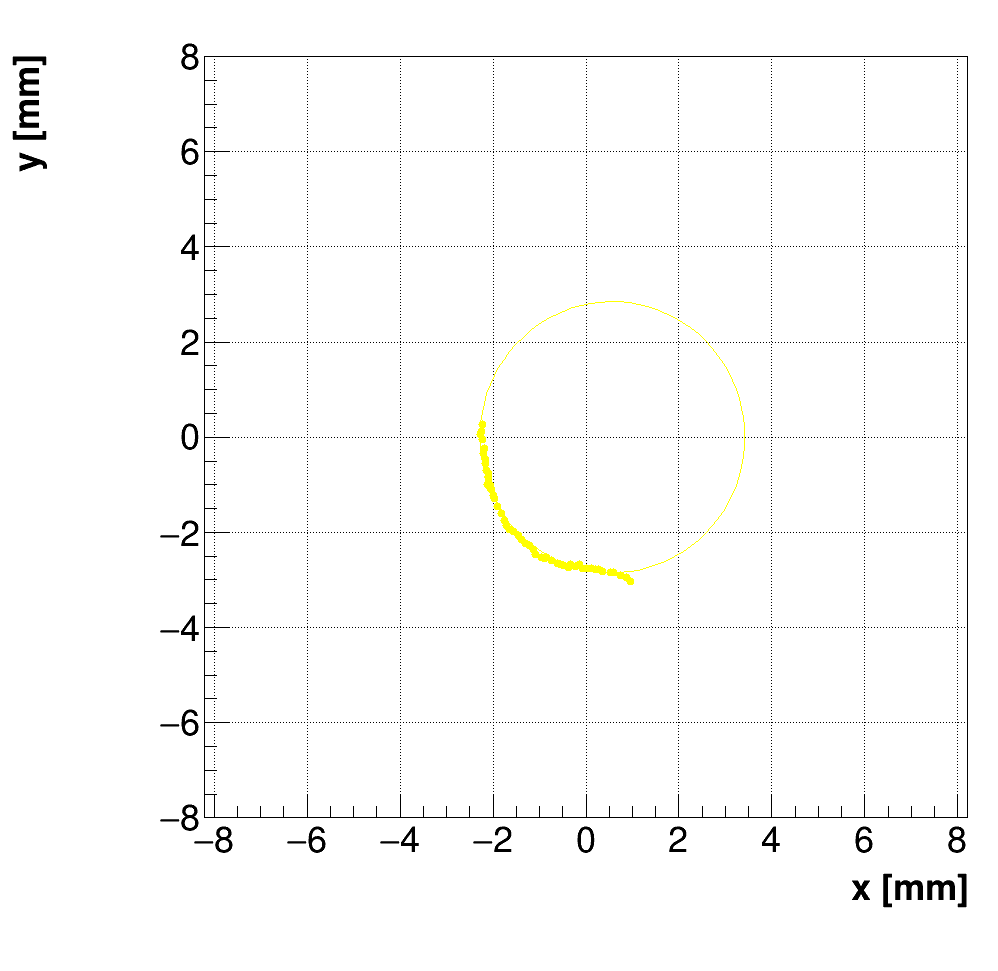
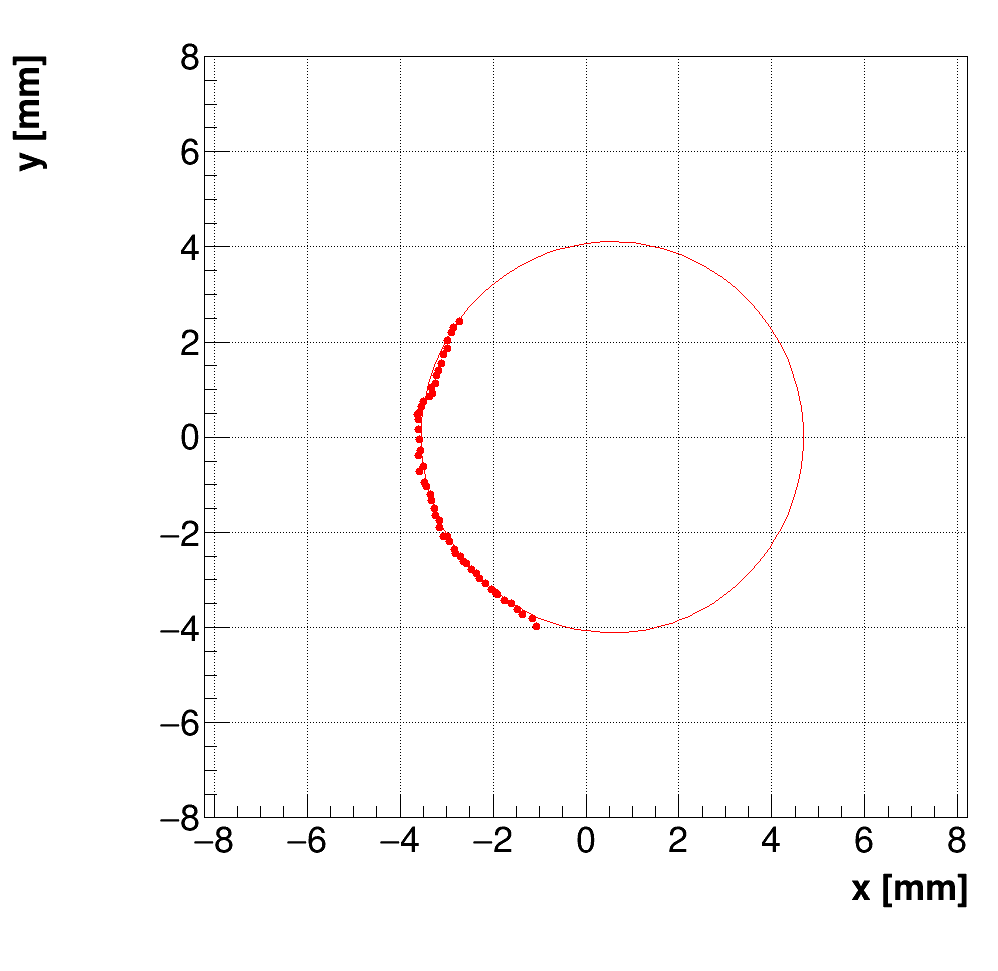
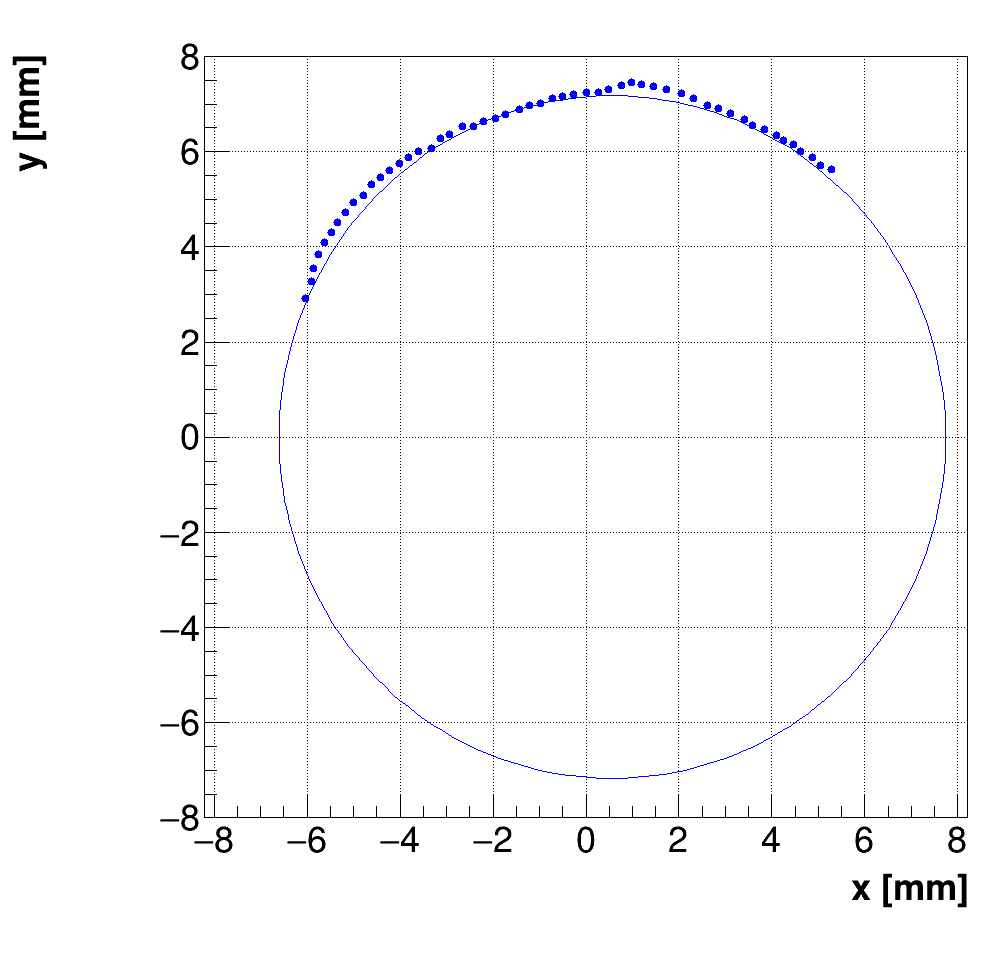
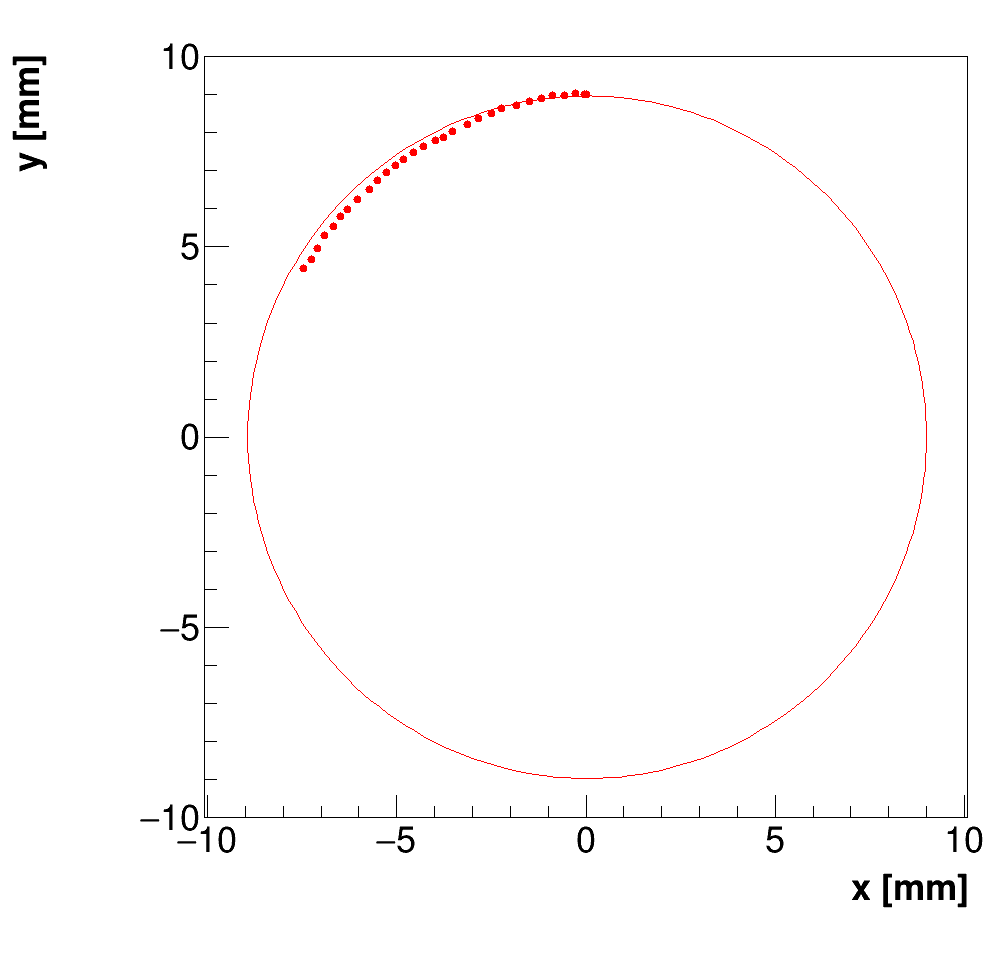
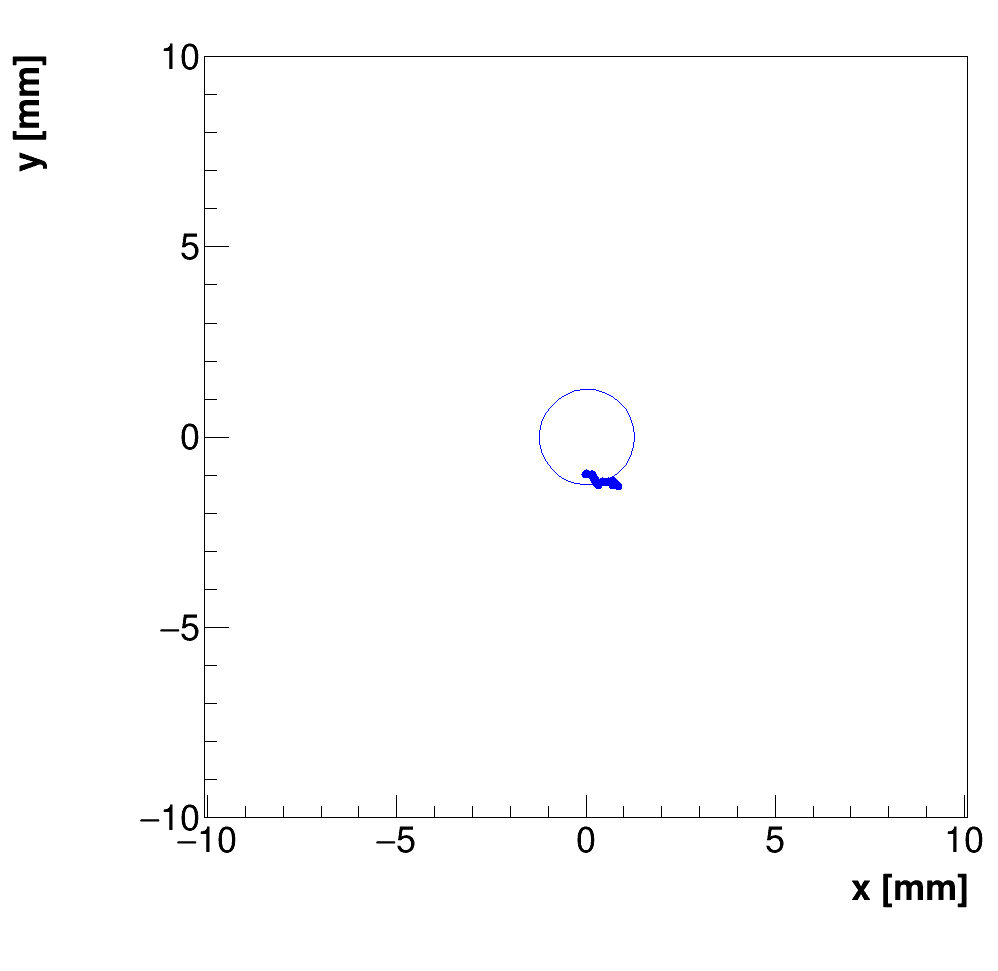
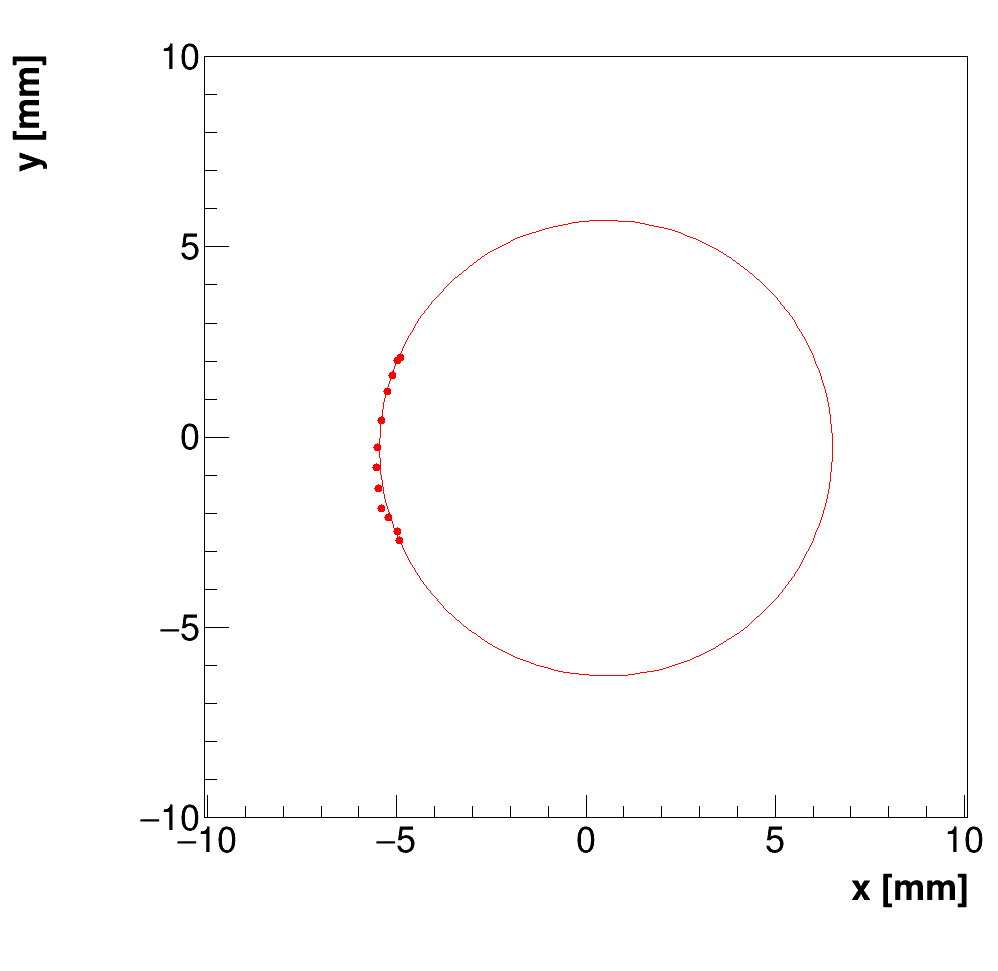
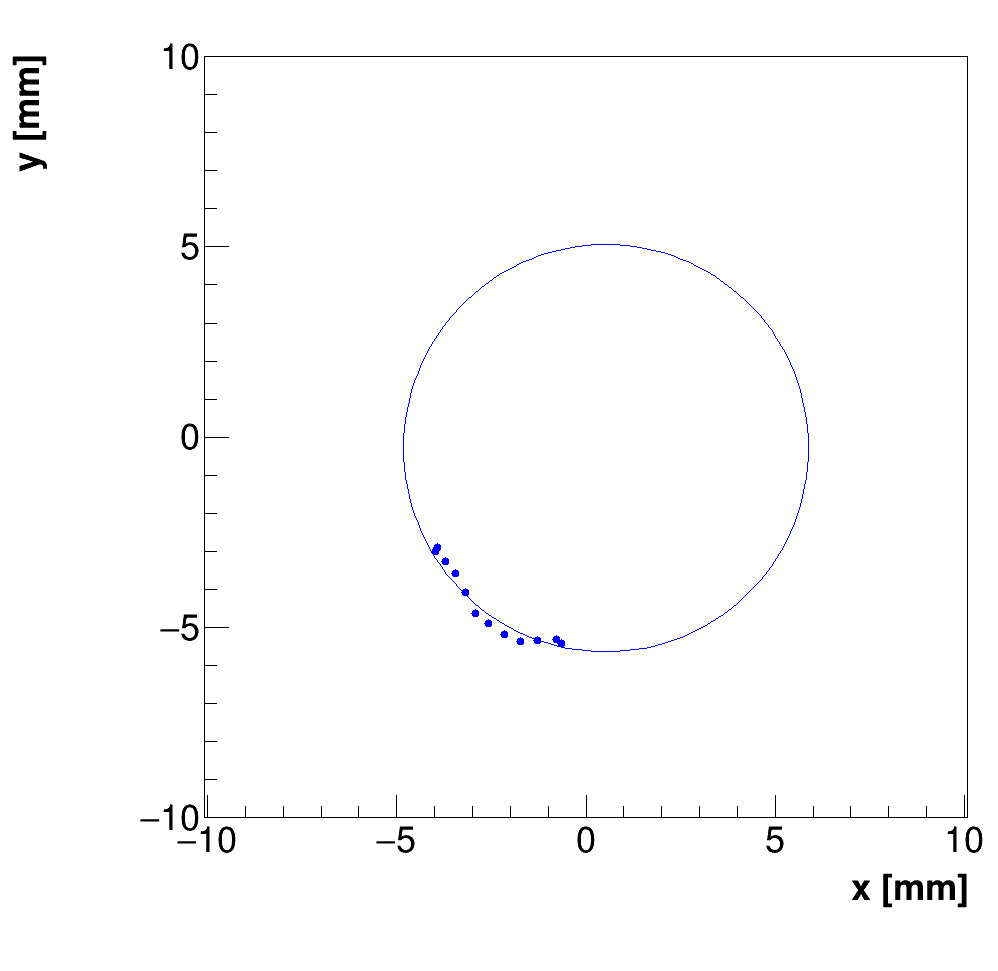
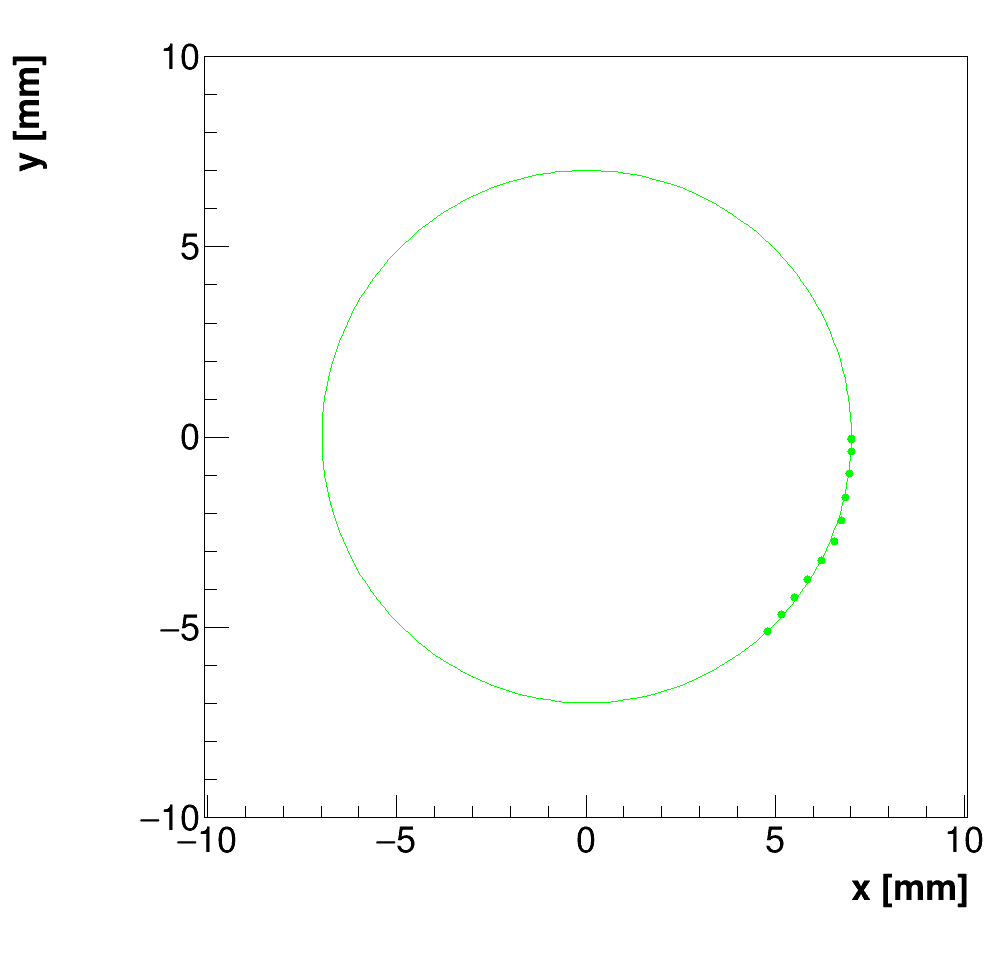
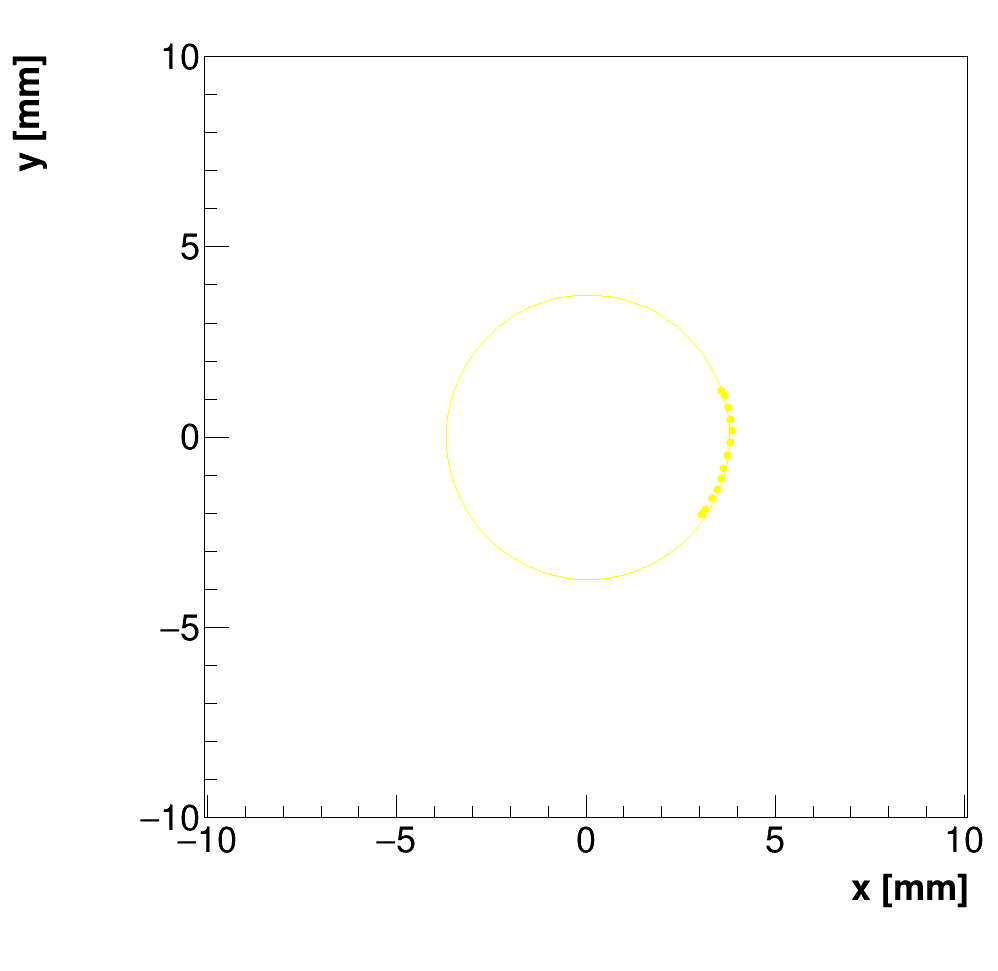
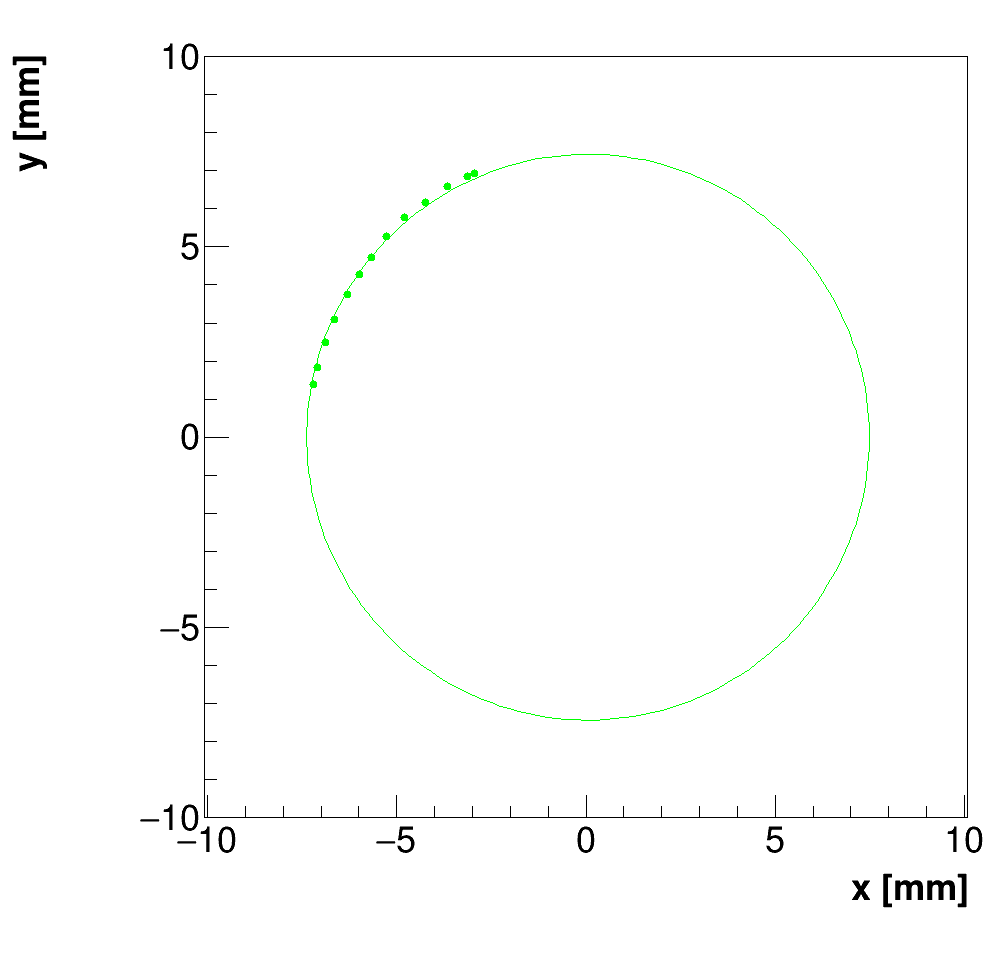
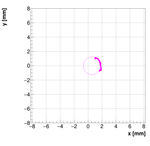
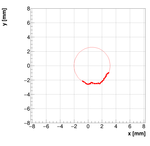
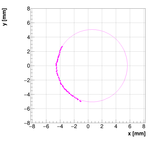
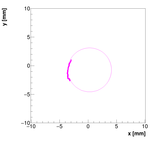
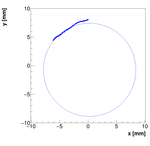
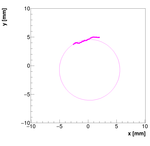
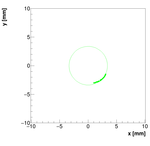
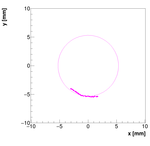
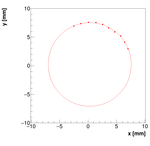
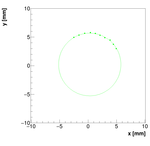
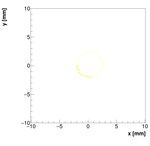
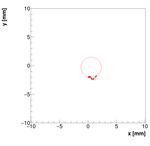
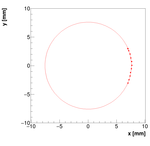
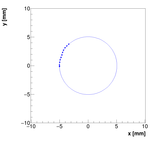
had a plateau. For details see pictures below. Once selecting "w" we inspected
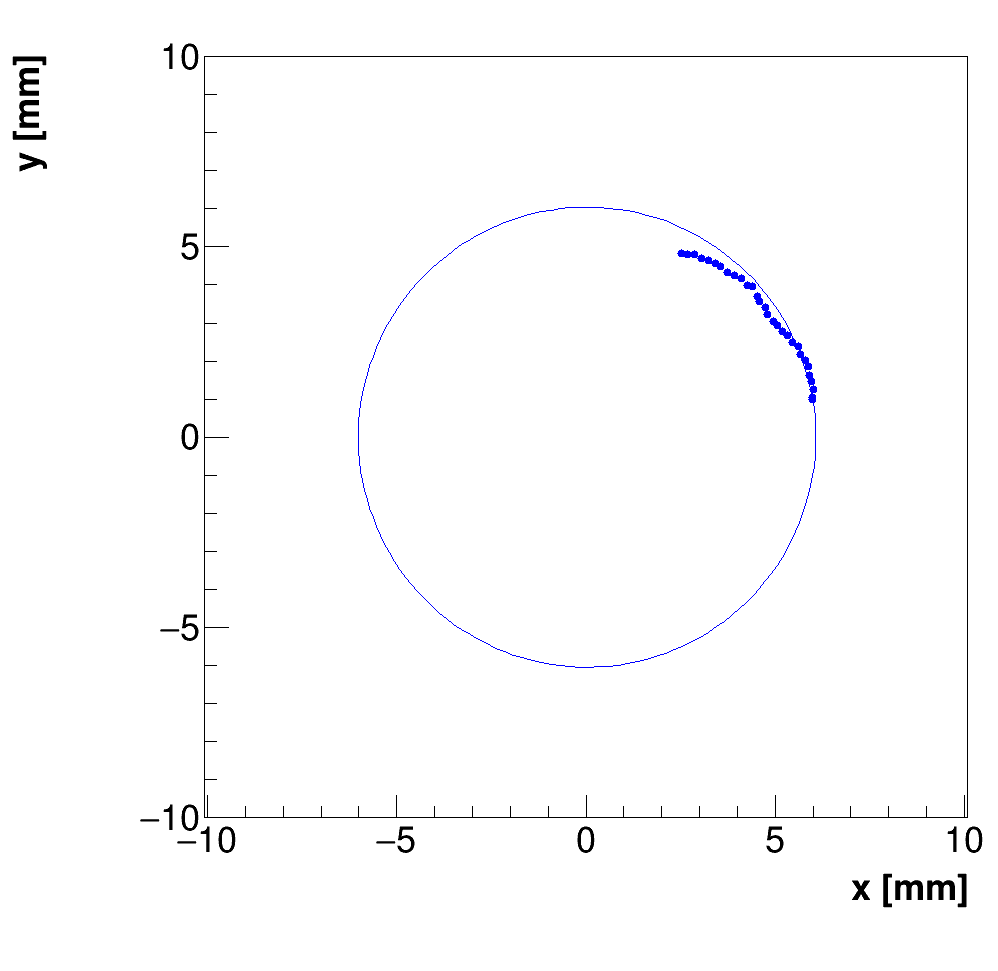
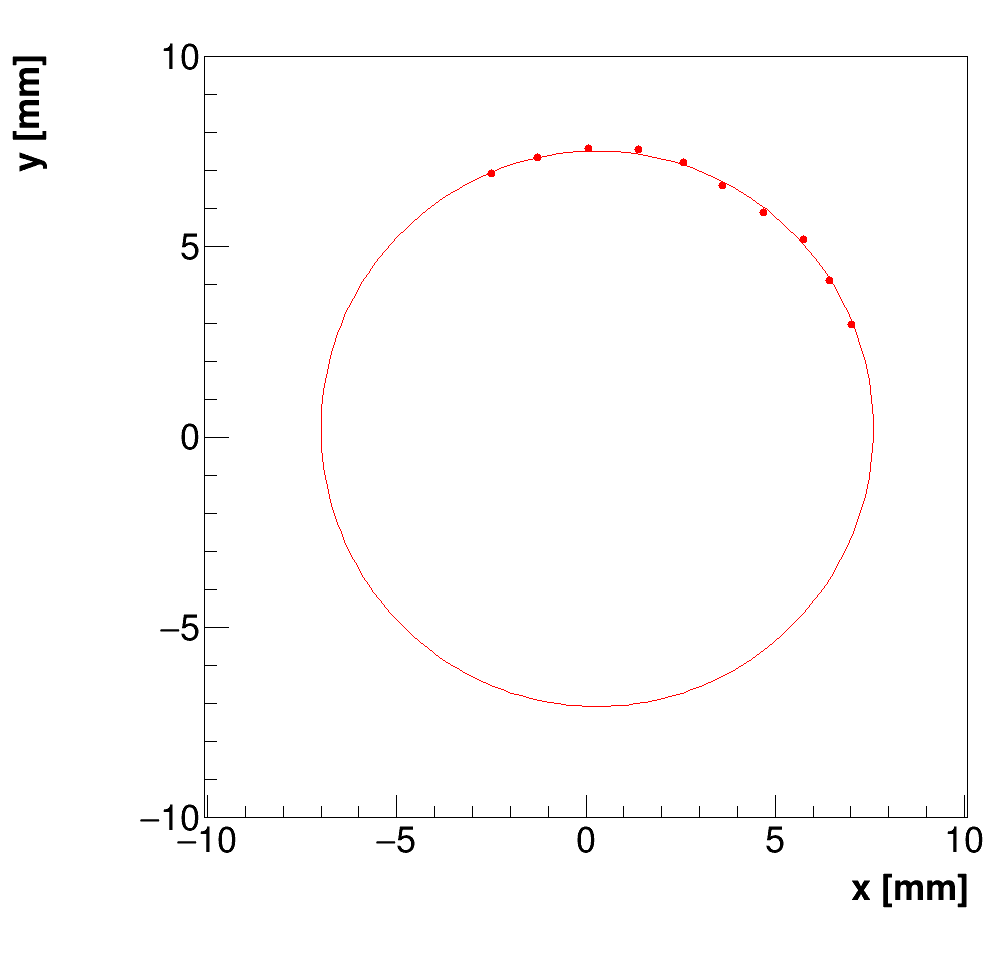
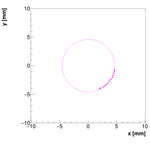
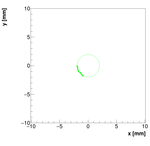
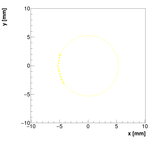
each arc separately to see, if the solutions works well for all of them. At
the end, final result was reported.
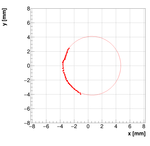
Analysis for Spec-A:
Results with different weights:


We decided to select w=1 as the optimal weight for spectrometer A.
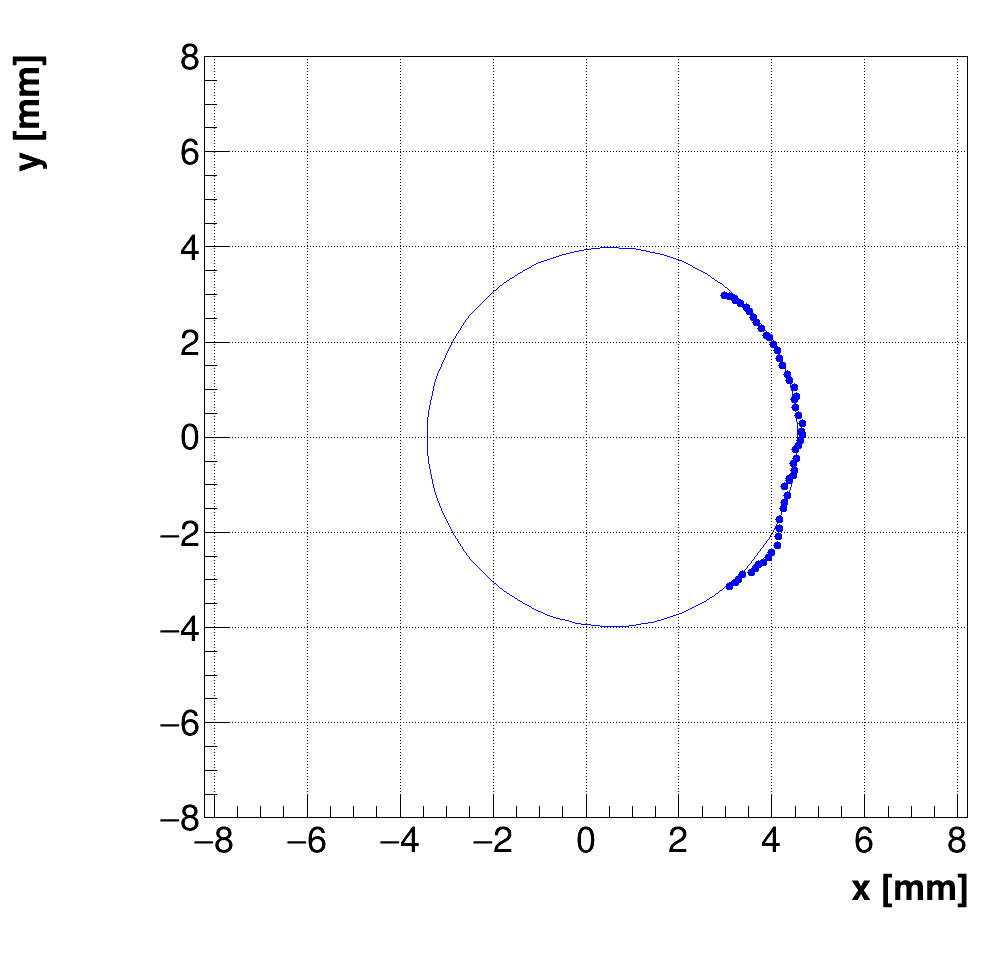
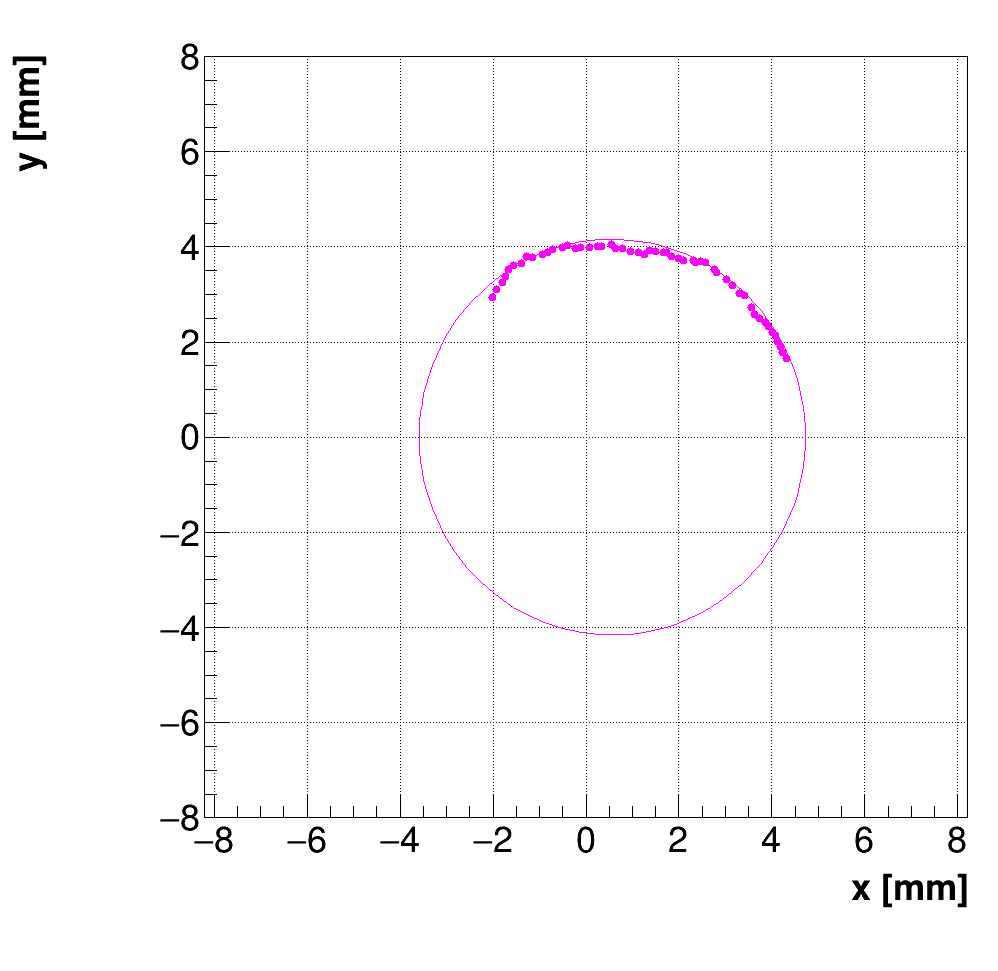
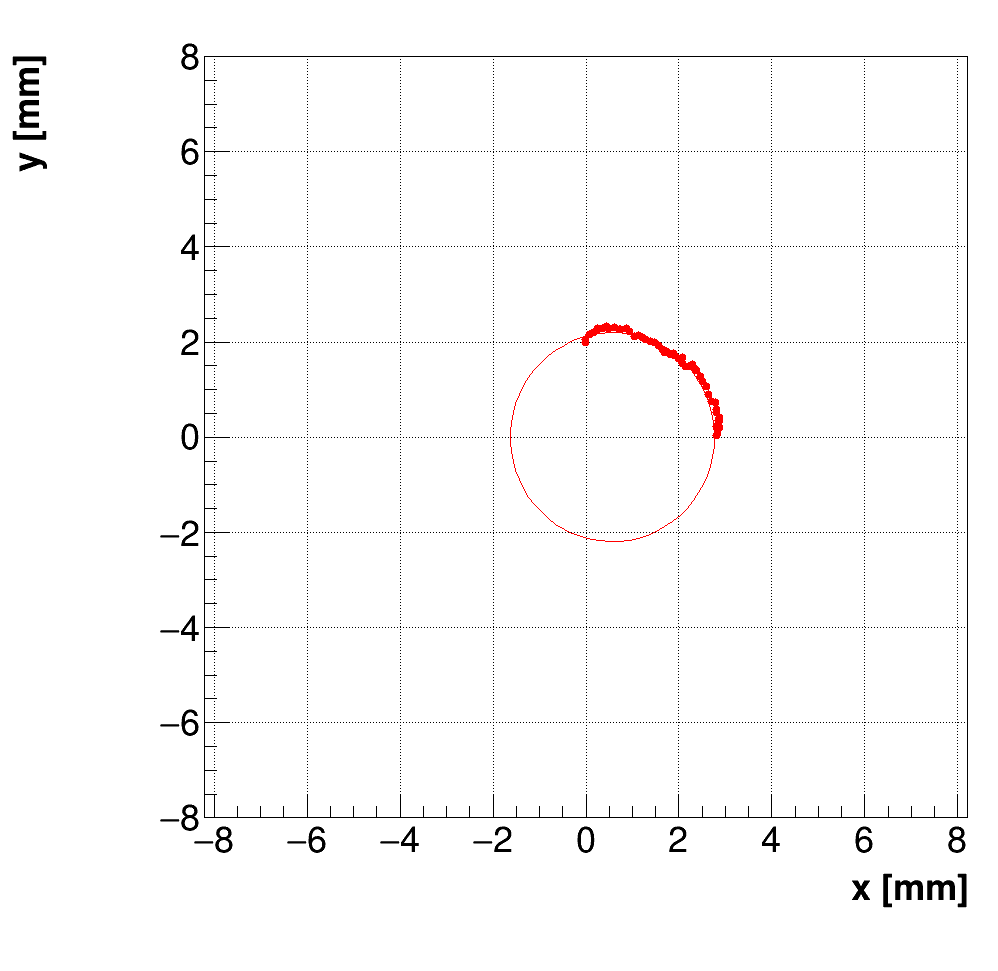
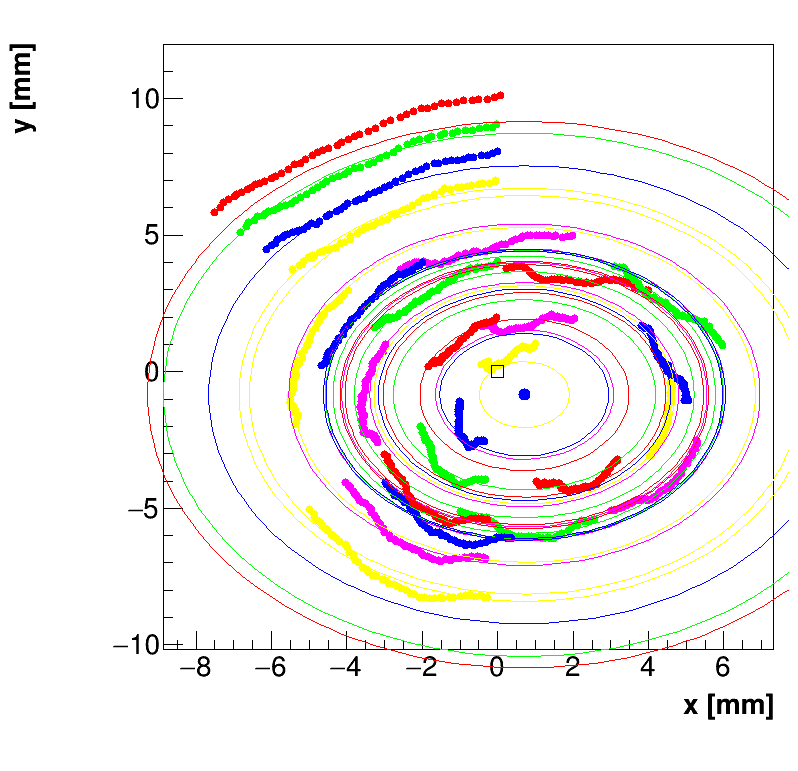
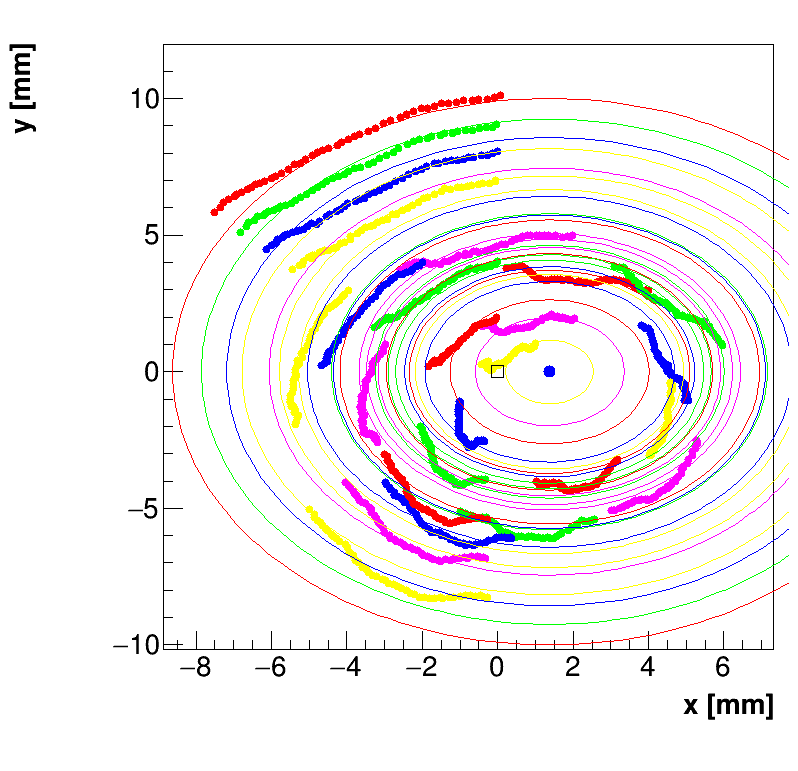
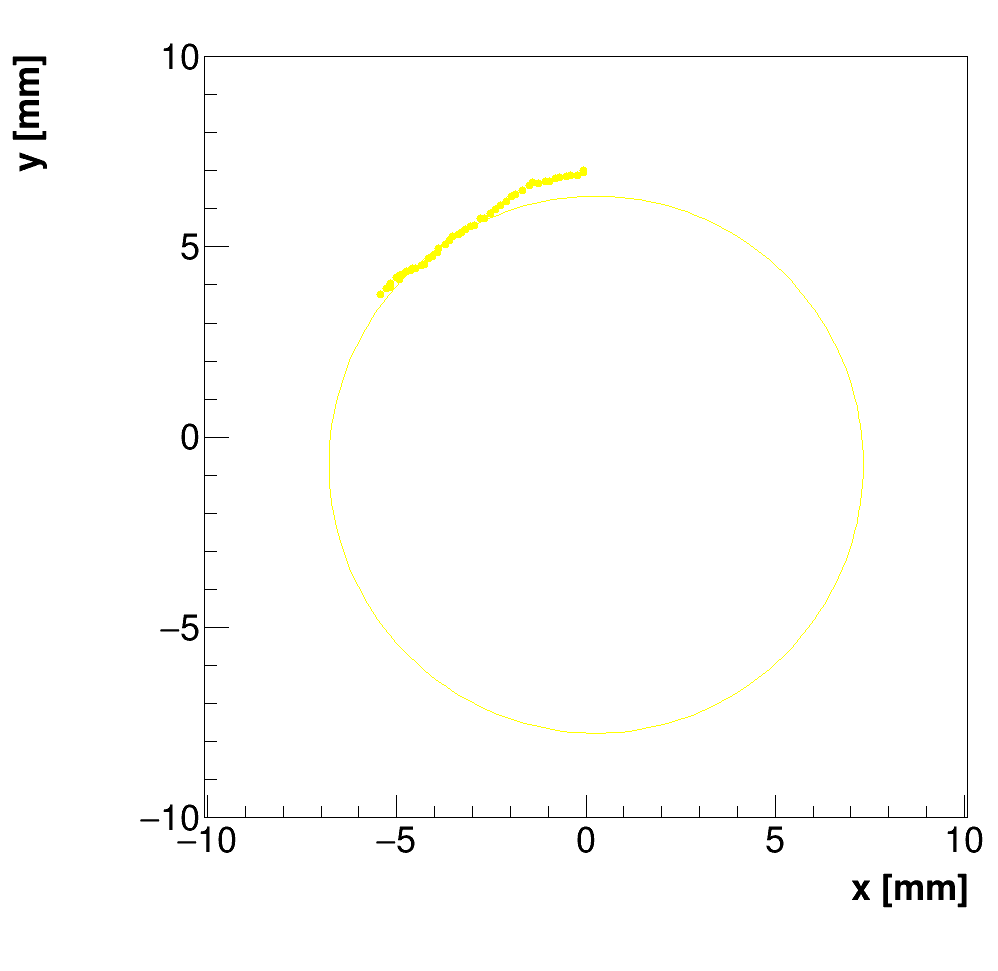
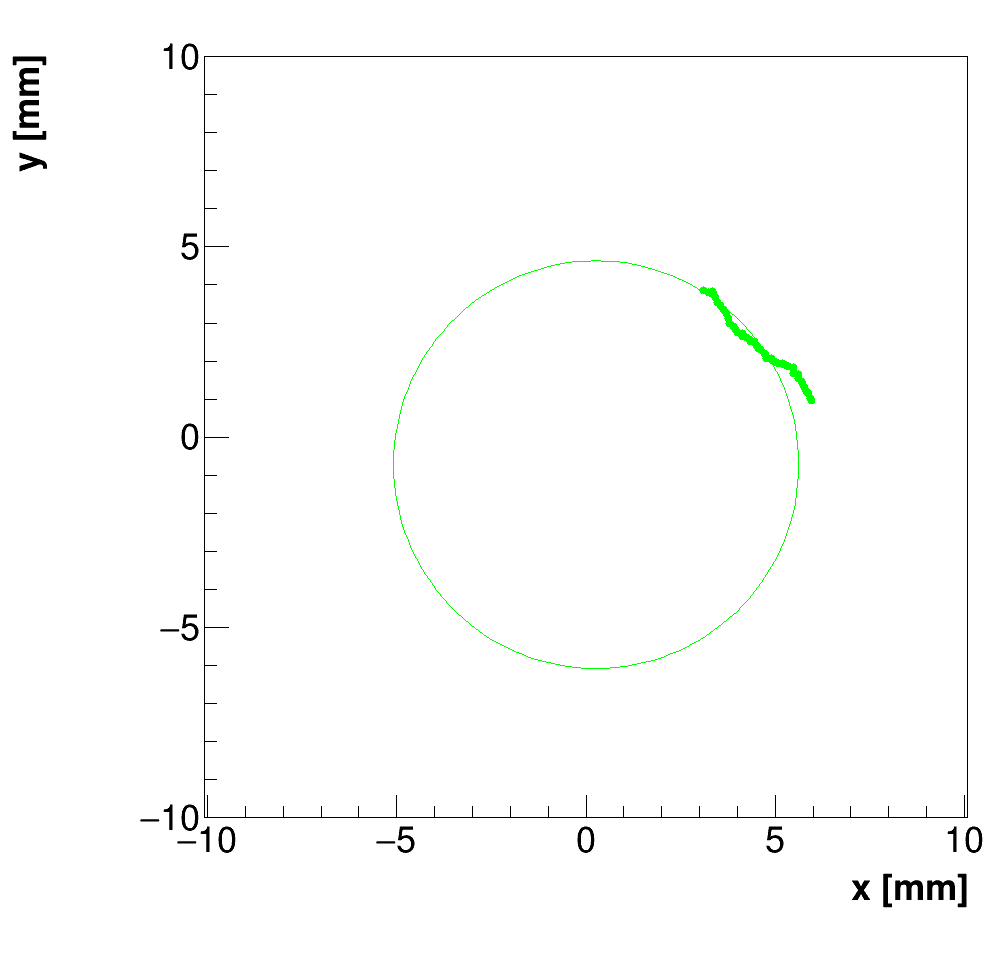
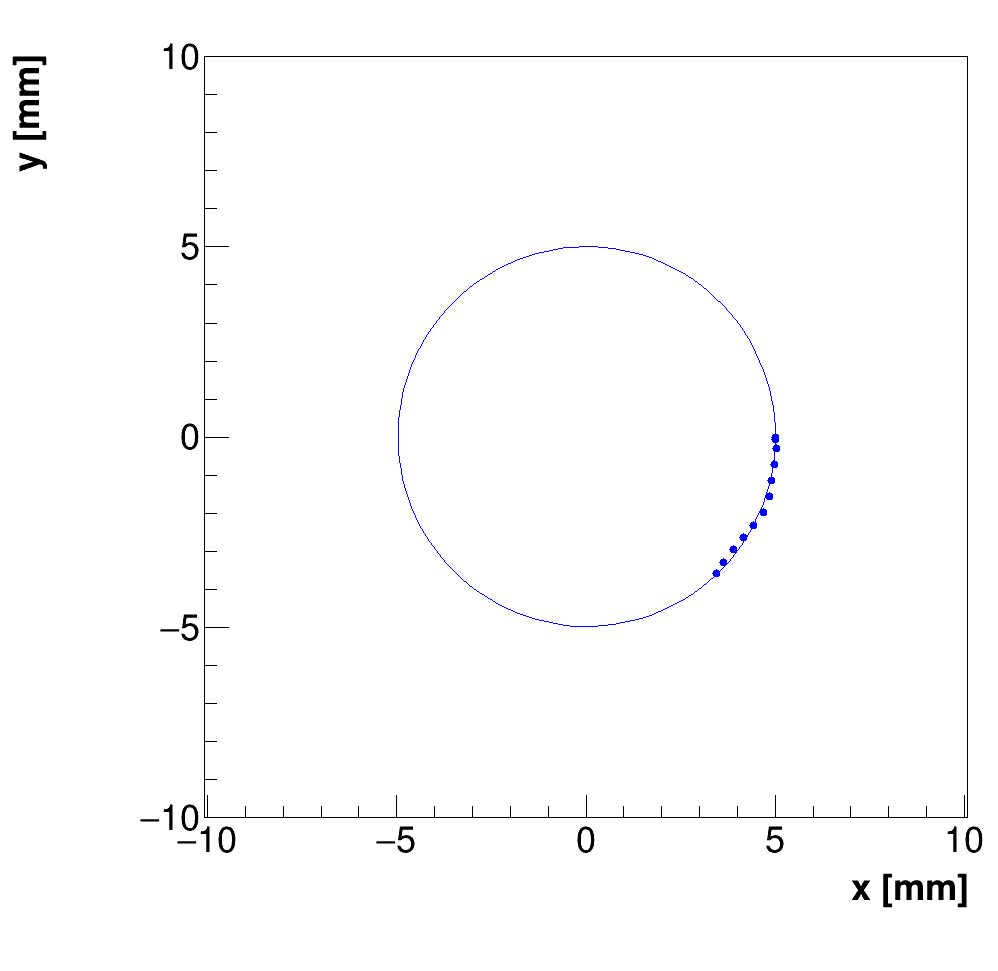
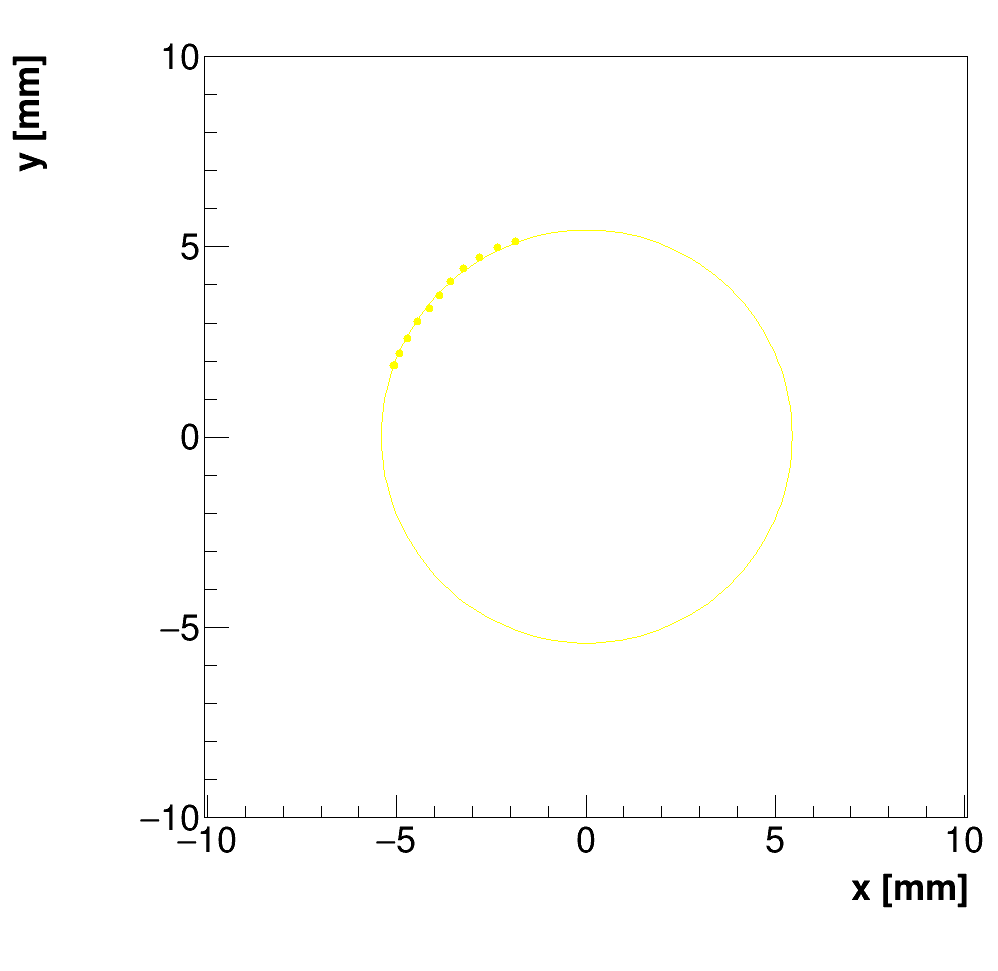
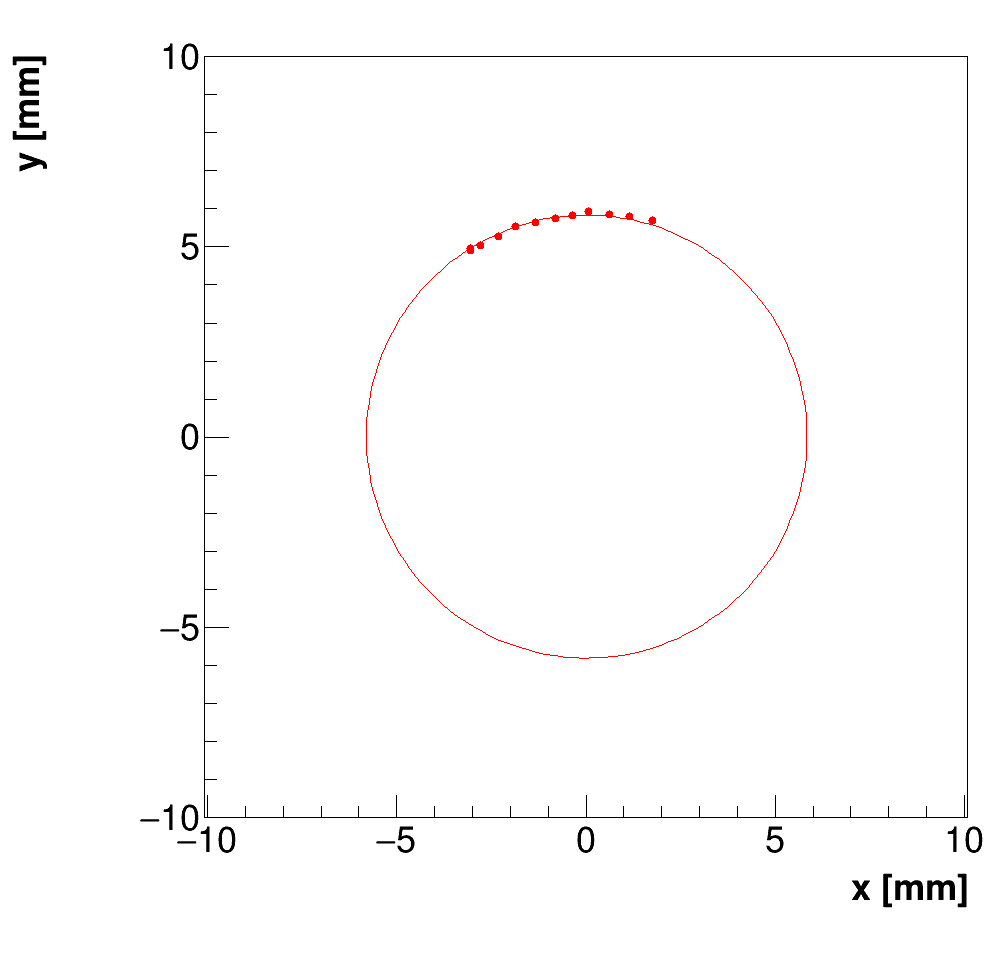
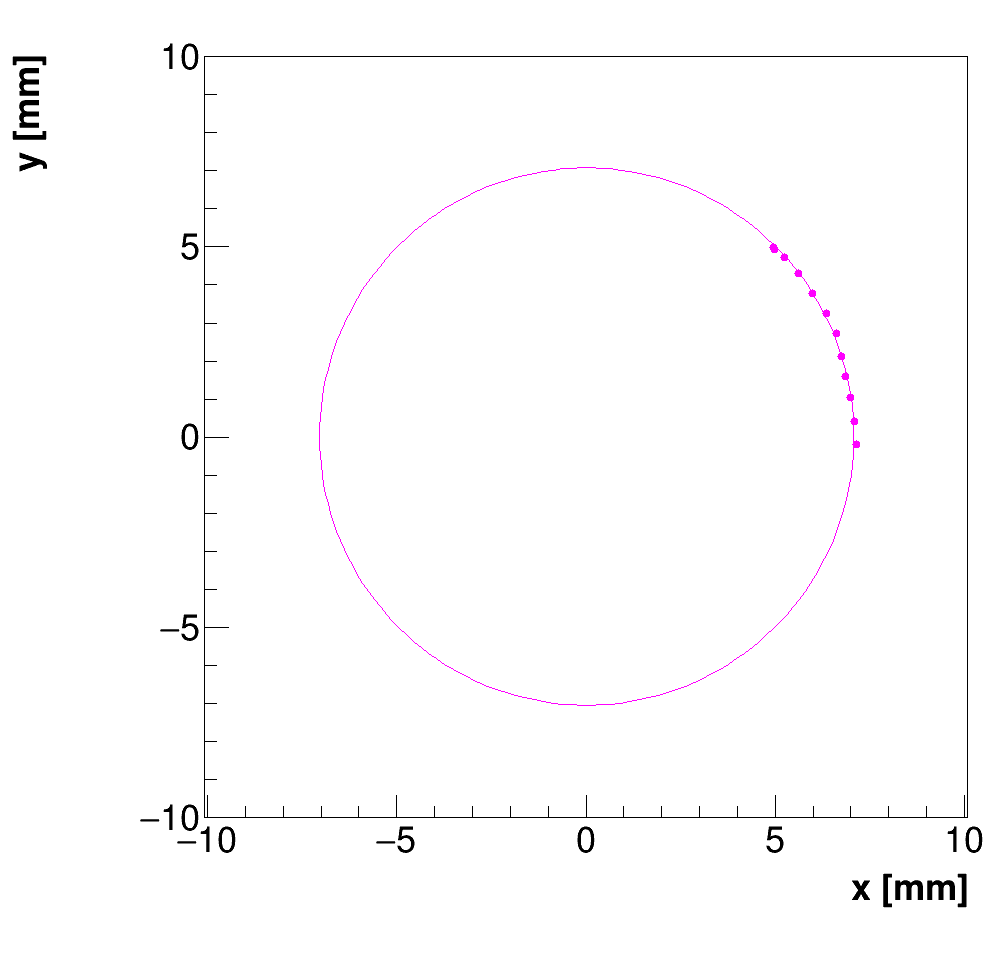
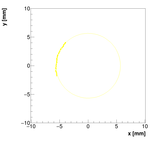
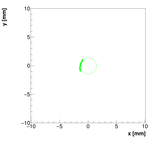
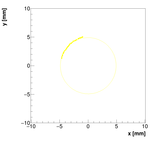
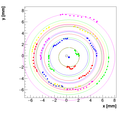
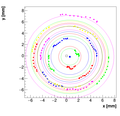
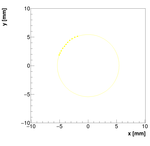
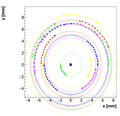
Single reconstructions for w=1.0


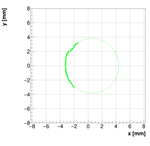


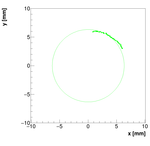
Analysis for Spec-B:
Results with different weights:


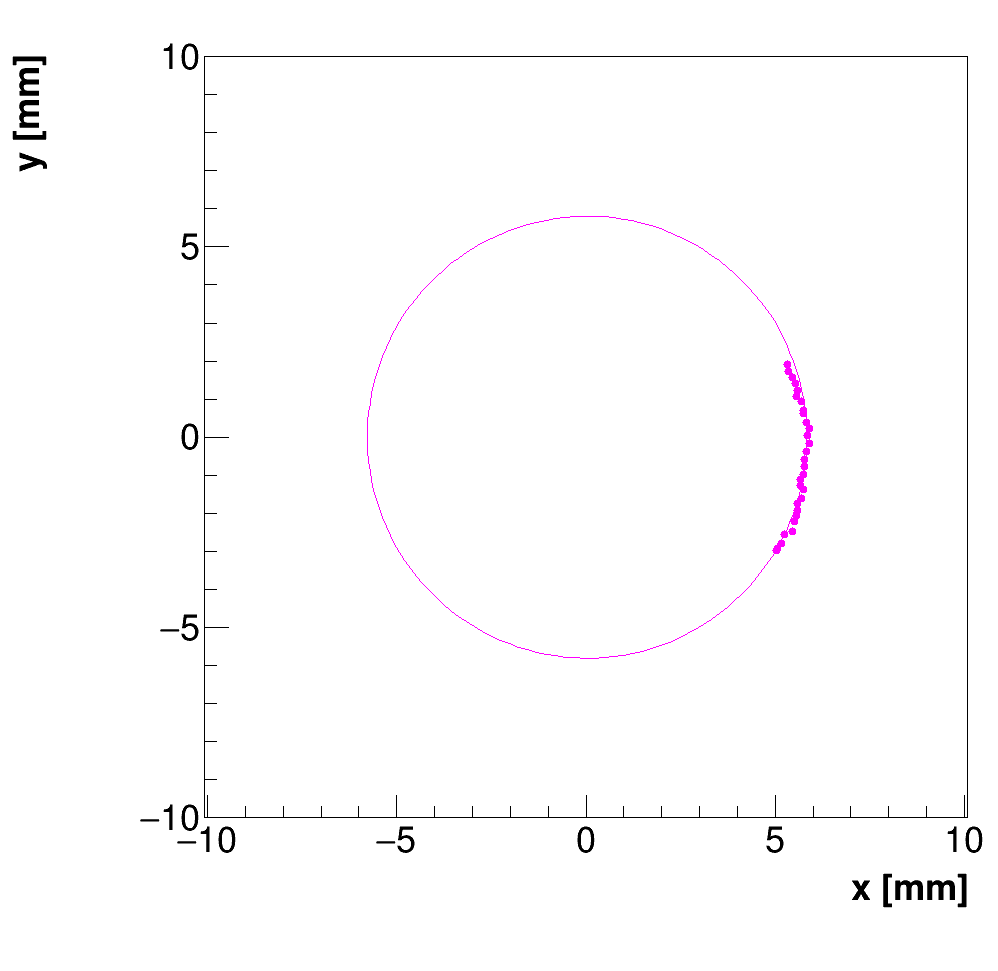
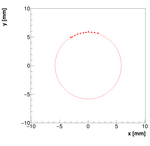
We decided to select w=0.5 as the optimal weight for spectrometer B.
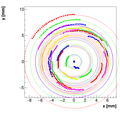
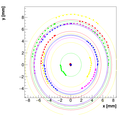
Single reconstructions for w=0.5


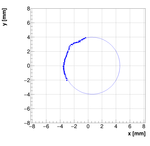
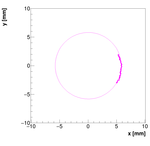
Analysis for Spec-C:
Results with different weights:


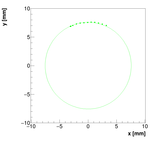
We decided to select w=1 as the optimal weight for spectrometer C.
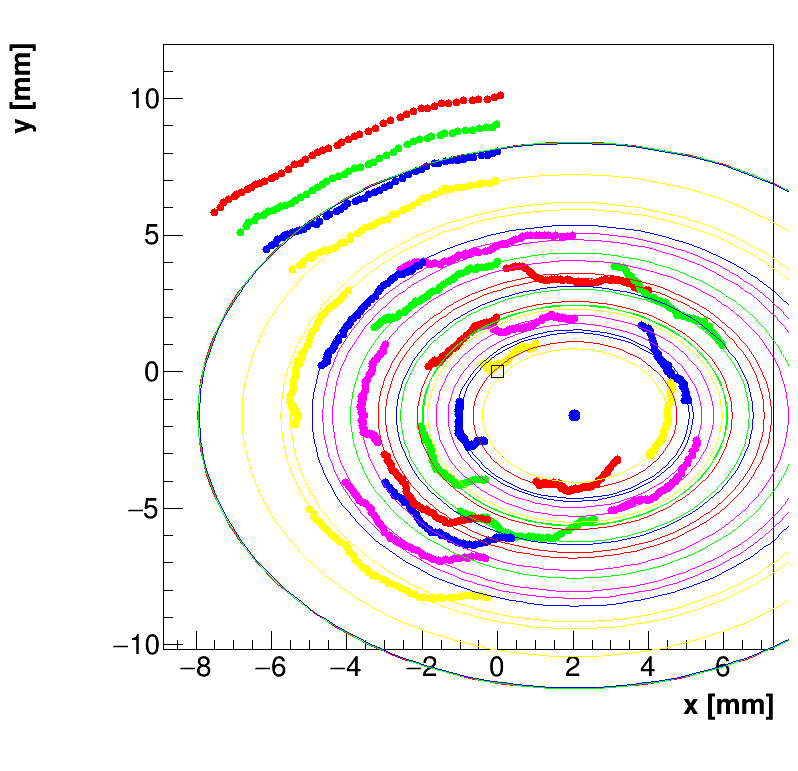
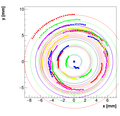
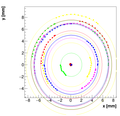
Single reconstructions for w=1.0


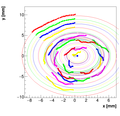
2013 Results:
The measurement we performed is not the first investigation of this problem. First
measurement was done in 2013, but not with so many points. Furthermore, the target
was not constructed and positioned as well as for this measurement. However, the
data were analysed and results are summarized in the following plot:

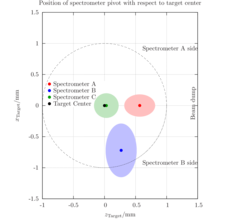
2016 Results:
Here are the final results of this measurement/analysis. The pivot points were
determined to be at (given in the lab coordinate system):
Spec-A: (x,y) = (0.5668, 0.001019) +/- (0.0182, 0.019217) +/- (0.08, 0.01) +/- (0.15, 0.15) mm
Spec-B: (x,y) = (0.2682, -0.720178) +/- (0.0397, 0.031951) +/- (0.06, 0.25) +/- (0.15, 0.15) mm
Spec-C: (x,y) = (0.0298, 0.000503) +/- (0.0298, 0.000503) +/- (0.08, 0.01) +/- (0.15, 0.15) mm
First uncertainty is statistical. The second one estimates the uncertainty/fluctuation related to the
choice of the weight. The third one is uncertainty in the determination of the central position
of the target, i.e., How well the center of the target agrees with the position of the antenna.
Reanalysis of 2013 data
The inconsistency between the 2013 and 2016 results encouraged us to redo the analysis
of the old plots with the new approach. The old analysis was very primitive. The
photos were manually read out using Gimp. Obtained pixel combinations were then transformed
to [mm] and offset for the the difference between the center of the paper and the
true position of the needle. The results of the new analysis are different, especially
for spectrometer C, and are consistent with the new results.
When analyzing the data I had special problems with the analysis of the
spectrometer B data. The minimum there was very unstable and it required some
thinking and adjustments to find, what I believe is a stable solution.
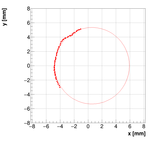
Spectrometer A:
Measurements:


OldSpecAData.dat
Results with different weights:


We decided to select w=0.05 as the optimal weight for spectrometer A.
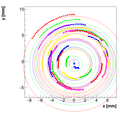
Single reconstructions for w=0.05


Spectrometer B:
Measurements:


OldSpecBData.dat
Results with different weights:


We decided to select w=0.1 as the optimal weight for spectrometer B.
Single reconstructions for w=0.1


Spectrometer C #1:
For spectrometer C we have two measurements with two positions of camera! This is the first one!
Measurements :


OldSpecCData.dat
Results with different weights:


We decided to select w=0.08 as the optimal weight for spectrometer C.
Single reconstructions for w=0.08


Spectrometer C #2:
For spectrometer C we have two measurements with two positions of camera! This is the second one!
Measurements :


OldSpecCData2.dat
Results with different weights:


We decided to select w=0.08 as the optimal weight for spectrometer C.
Single reconstructions for w=0.08


Updated 2013 Results:
Here are the final results of this measurement/analysis. The pivot points were
determined to be at (given in the lab coordinate system):
Spec-A: (x,y) = (0.293524, 0.219333) +/- (0.00418, 0.03064) +/- (0.05, 0.05) +/- (0.2, 0.2) mm
Spec-B: (x,y) = (0.529904,-0.287745) +/- (0.529904,-0.287745) +/- (0.1, 0.1) +/- (0.2, 0.2) mm
Spec-C #1: (x,y) = (0.0184613,0.0165967) +/- (0.0550165, 0.00219943) +/- (0.02, 0.02) +/- (0.2, 0.2) mm
Spec-C #2: (x,y) = (0.02024, 0.0448504) +/- (0.02024, 0.0448504) +/- (0.02, 0.02) +/- (0.2, 0.2) mm
First uncertainty is statistical. The second one estimates the uncertainty/fluctuation related to the
choice of the weight. The third one is uncertainty in the determination of the central position
of the target, i.e., How well the center of the target agrees with the position of the antenna.

Results of the 2016 measurements together with the remake of 2013 results:

Last modified 2.9.2016