Meeting No.7
New extraction of the proton radius:
Today's extraction of the proton radius using the new approach from Jan!
01.) 
Snout Problem:
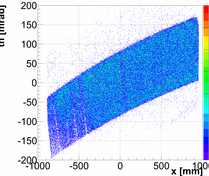
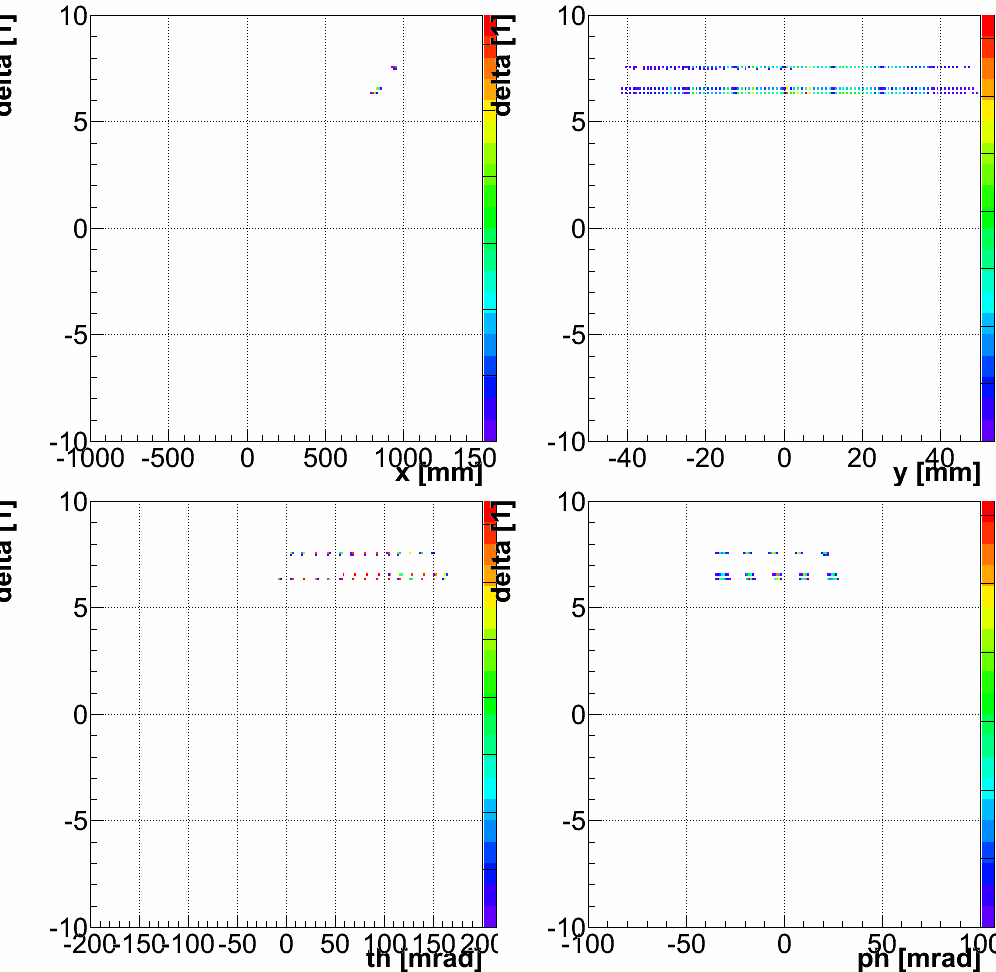
We reconstructed the position of events at the entrance window of the spectrometer B.
While the left/right walls are at the correct positions, the up/down walls appear
within the spectrum (for factor 2). I have used my stand along simulation to inspect
the origin of this and learned that the effect is a result of the optics. Events
coming from the frame closer to the spectrometer indeed appear in the spectrum at
the edge of the acceptance. Hence, the problem is a result of the
insensitivity of the spectrometer in y direction. ERROR: it should be
dp=0, z=0, y=0, th=4deg.
02.) 
03.) 
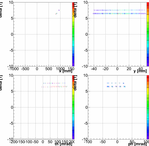
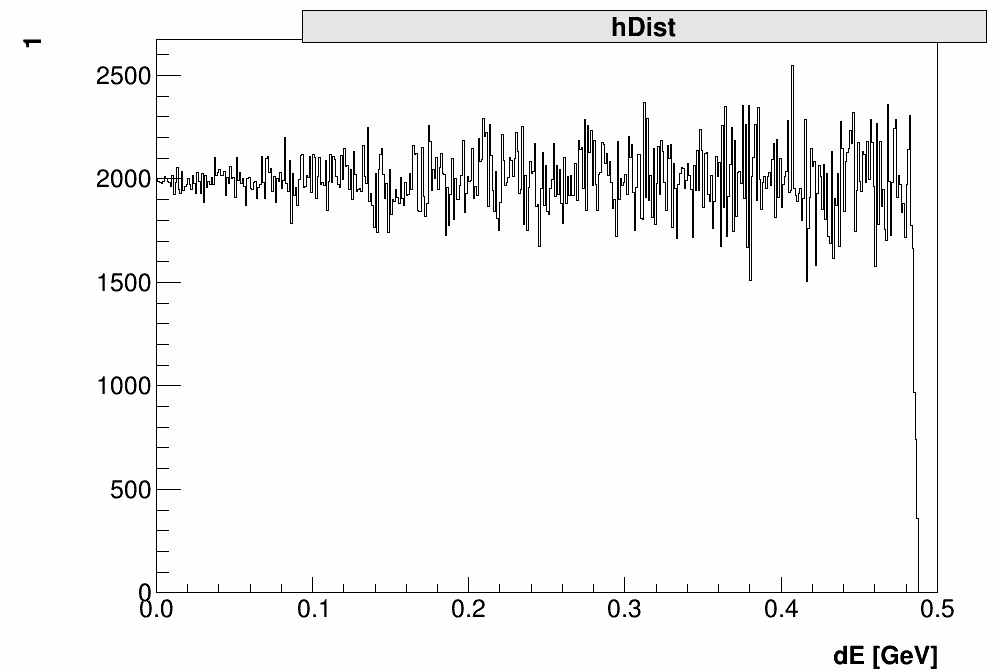
The Radiative tail simulation:
I am working on the stand alone simulation in order to understand in detail
the radiative tail. This is still work in progress. The red line is full simulation,
blue is the peaking approximation when different generators are used
to throw events and peaking distribution is used as weight. The green line
represents peaking approximation, when weight =1 and events are thrown according
to this distribution.
When uniform distribution is used, the reconstruction of the peak is bad.
At the moment I am trying to understand the effects of the higher order
corrections.
Full:
04.)  05.)
05.) 
Uniform:
06.) 
Uniform with out "rest correction" in th epeaking approx.:
07.) 
Full without higher order corrections:
08.) 
Optics:
The problem:
My and Helene's matrix are not giving consistent results at very high momenta,
at the edge of the momentum acceptance. This causes difference in the delta
spectrum, what Adrian observed. The problematic events are all having very high
theta_FP angles. Hence, I suspected that I am lacking the calibration data
to fix the calibration there.
09.)  10.)
10.) 
11.) 
12.) 
13.)  14.)
14.) 
15.) 
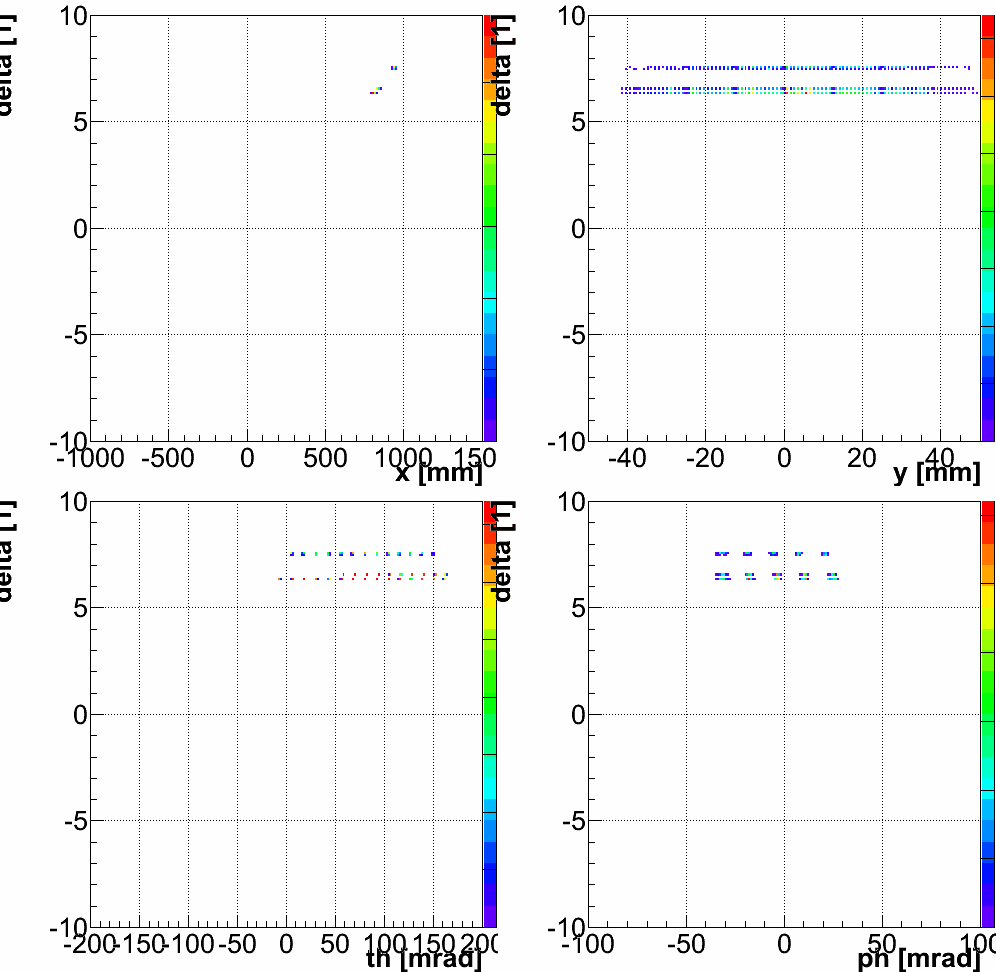
Missing data:
We indeed had a problem with the data in that corner (but not on the edge). This was
a result of the wrong settings of the Paddle masks. hence, one half of the acceptance
is missing for that setting!
16.)  17.)
17.) 
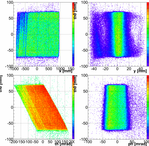
Helenes Matrix:
However, I tested the matrices not only on the ISR data but also on the calibration data sets
and I believe now, that Helene's matrix has a problem. When checking calibration
data points should be on the straight line, but they are not. See the comparison
of the reconstructed and set values.
18.)  19.)
19.) 
Mihas matrix:
When doing the same test with my matrix, the results are better.
20.)  21.)
21.) 
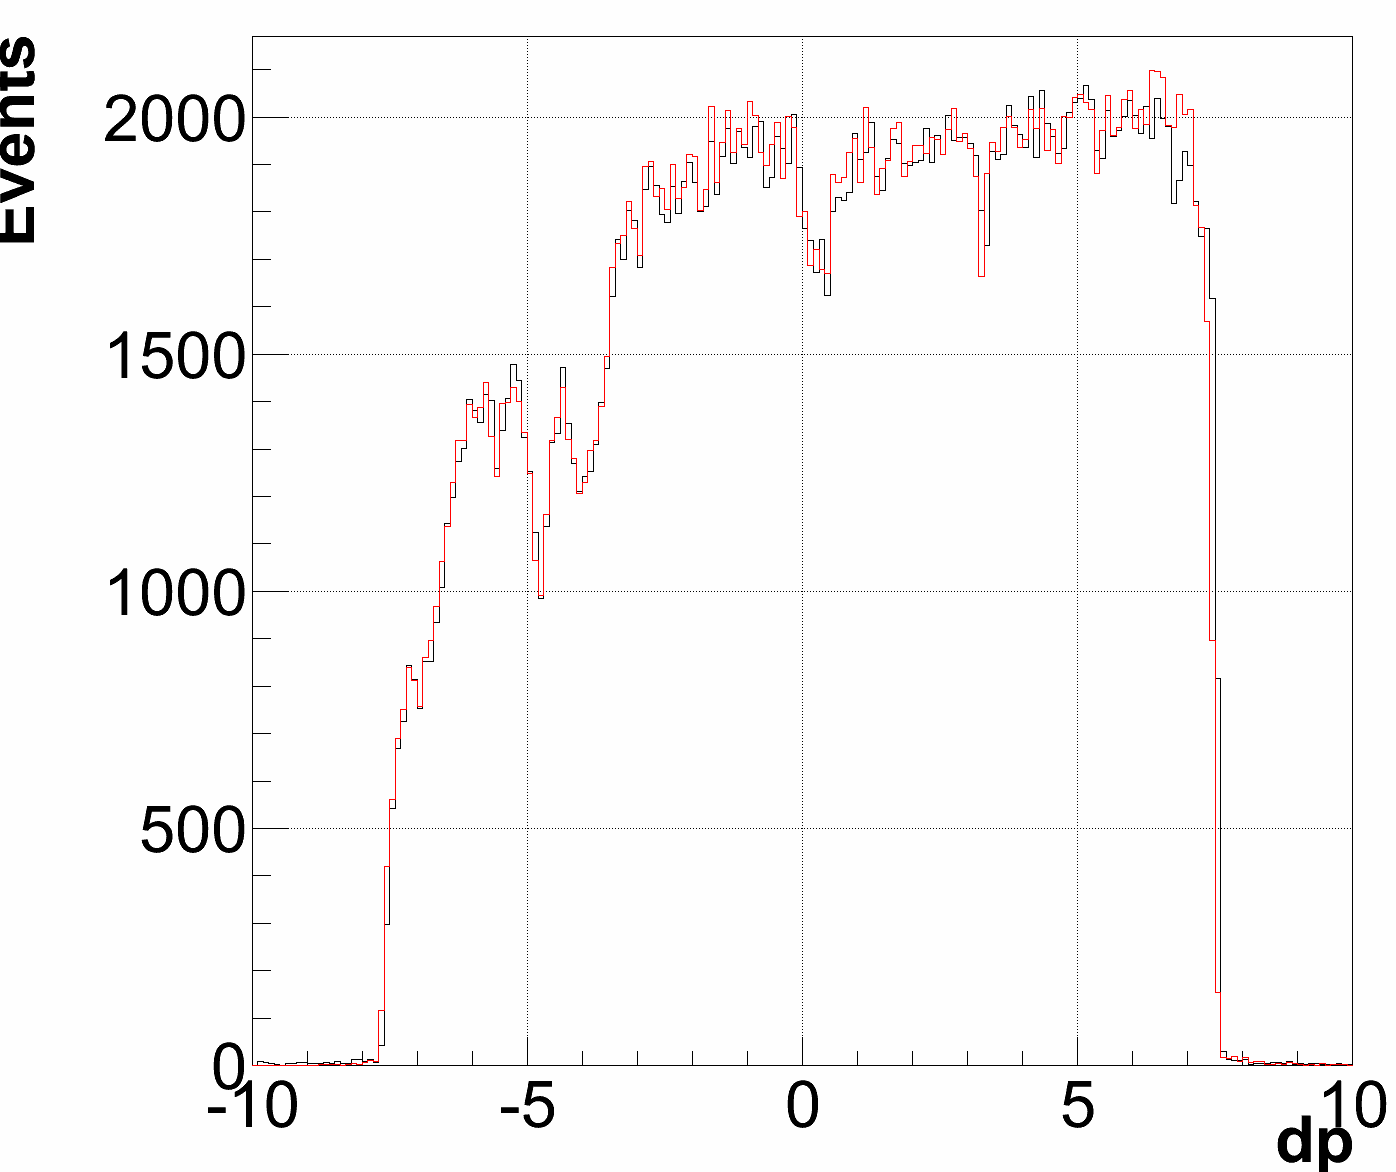
Final Remark: We thought that the oscillation we see in the dp distributions of the ISR data
was result of the mistake in the optics. This is not necessary true. The matrix
calibration does not care about the amount of events, only on the position
of the peaks. Furthermore, the main matrix element is the linear element (dp|x). All
the remaining elements are much smaller. Hence, this means, that an excess/lack
of events in the order of few percent can not come from the matrix - I think- but
is a consequence of something else.
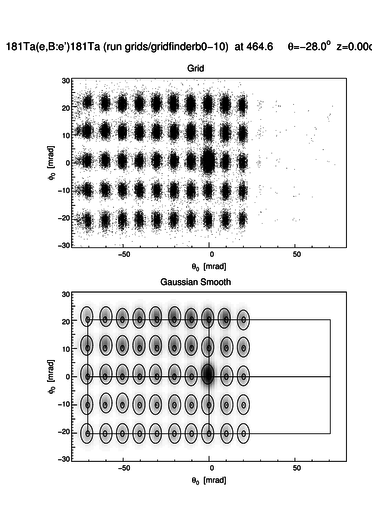
195MeV Problem and analysis:
When using 495MeV matrix on the 195MeV data I got strange results, ie. two peaks in the resolution
plot instead of one. This led me to the conclusion that beam energy changed for 1/2 of the data points.
This is consistent with the shutdown of the MAMI at exactly that time. They had a leak and in the
recovery process, the end energy was a bit different.
I also learned that for Spec-B grid finder considered beam energy only to the precision of 1MeV.
Hence, to correct the observed mistake, I had to change the scripts, that now work to 10keV.
22.)  23.)
23.) 
Last modified on 01.04.16


 05.)
05.) 


 10.)
10.) 


 14.)
14.) 

 17.)
17.) 
 19.)
19.) 
 21.)
21.) 
 23.)
23.) 