Meeting No. 16
Data analysis:
In the last past months I did several changed to the analysis in the attempt to
understand the first "elastic" point. These changes distorted also other parts of the
analysis. Hence, I had to recover from the changes and return to the status of
the Feb2016. The consensus is, that we leave elastic point out due to the problem with
numerics in the higher order corrections, when soft photon is very soft. However,
the radcorr factor is still needed! To many simulated events in the elastic line
could still distort the events in the tail via other types of losses. Hence, the
analysis we had at the beginning of the year was right!
The ultimate question is, how sensitive are our data really to the FFs. We are
aware that the change is small, because we are at very low Q2. However, are we
able to say something about the FF or are we dominated by the lepton diagrams?
Hence, I redid my analysis with with the dipole approximation instead of the
Bernauer parameterization. Turns out, that with the given statistics, we can
see approx. 2sigma effect in the tail region. However, with the given precision,
we can not distinguish between Bernauer and Pohl radius.
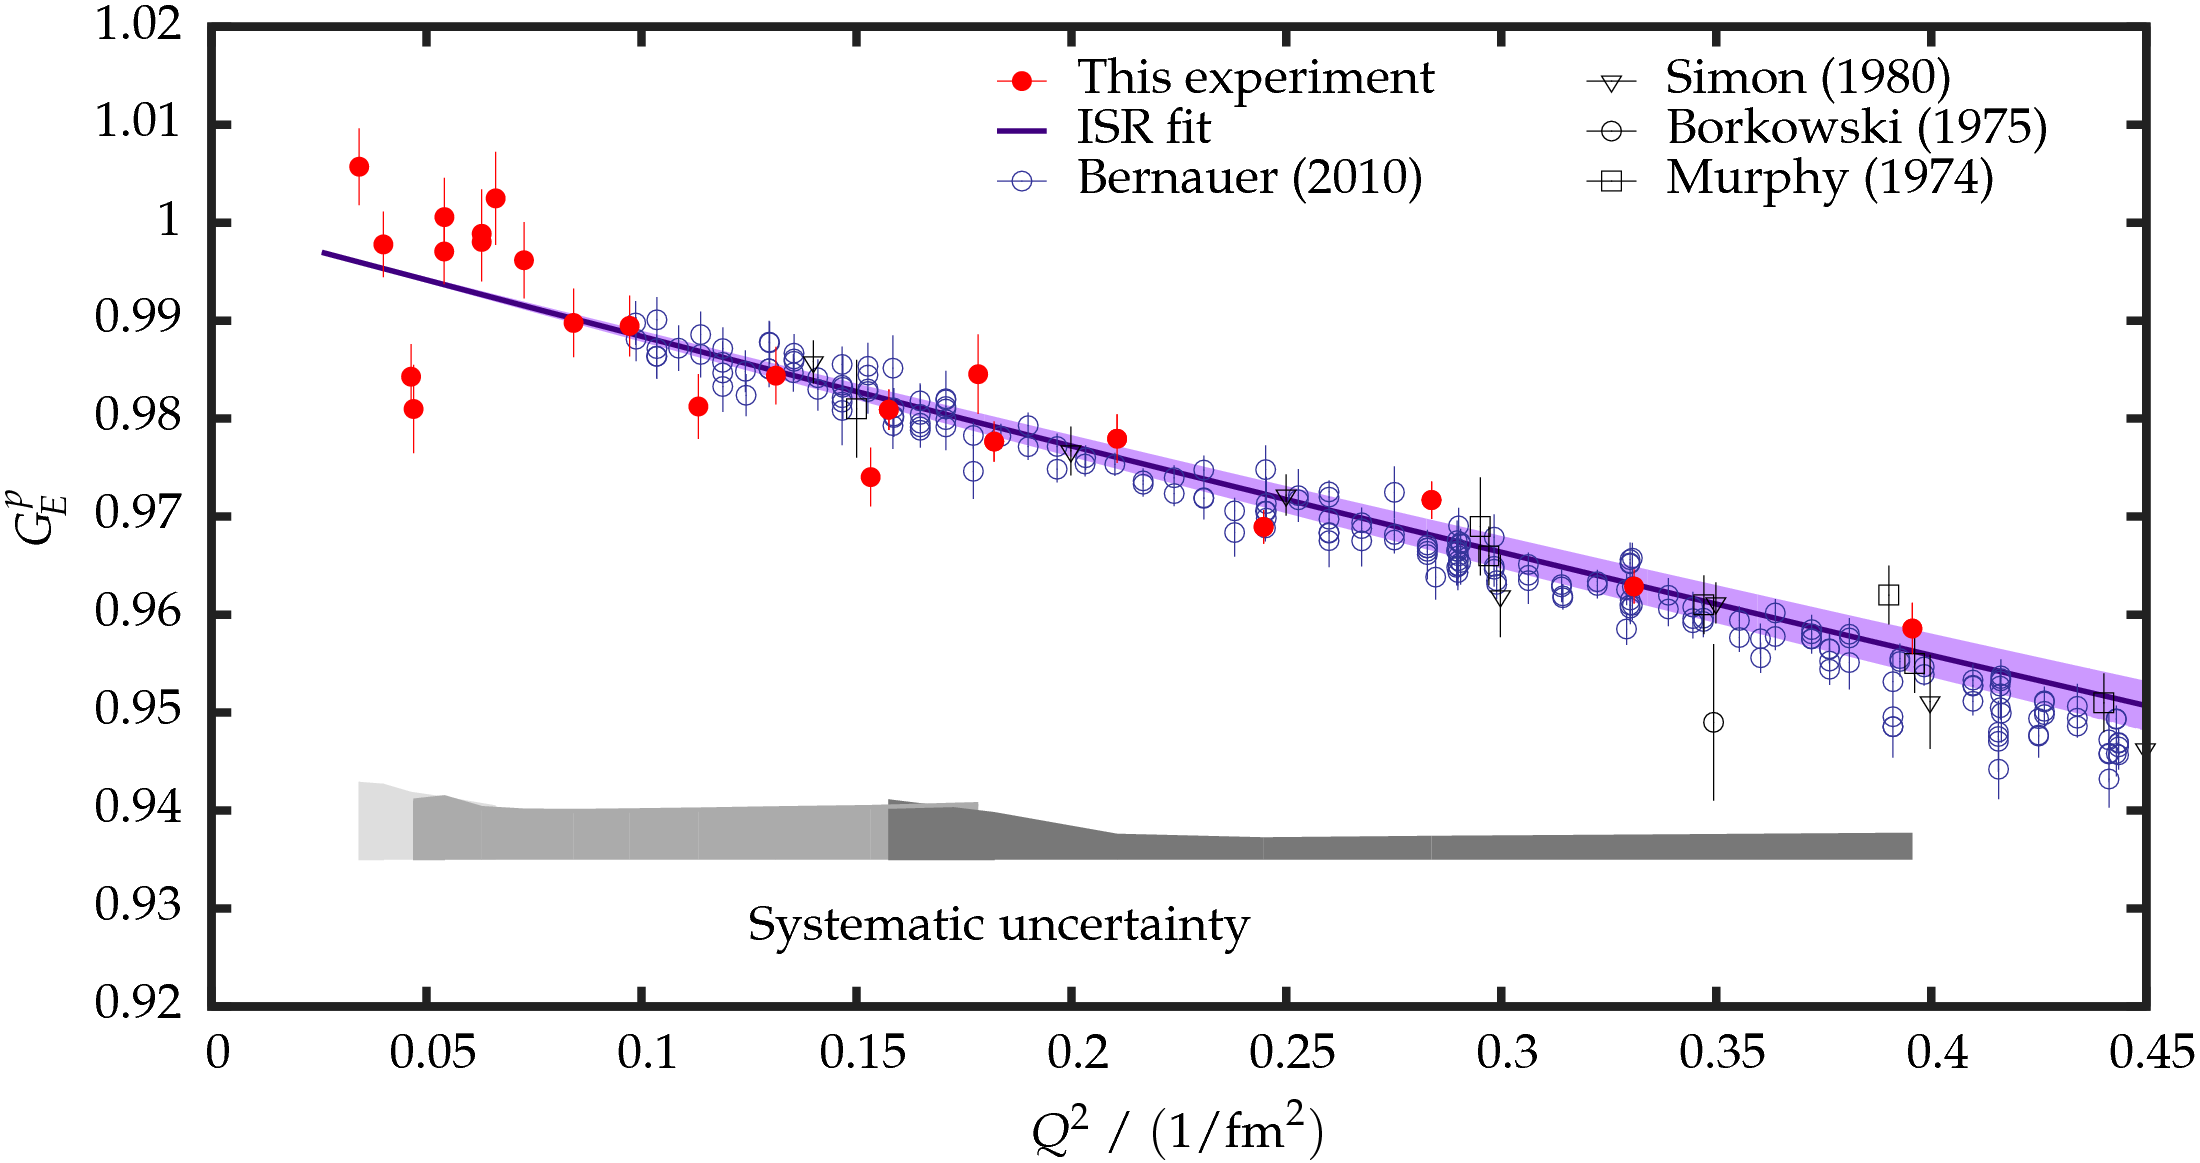
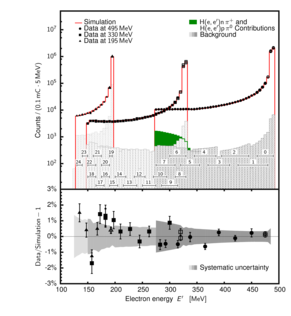
Following plot show the comparison of the simulations with our polynomial fit with
respect to the standard dipole parameterization, together with the data. The full
circles demonstrate data with respect to Bernauer, empty circles show data with
respect to dipole approx.
1.)  2.)
2.)  3.)
3.) 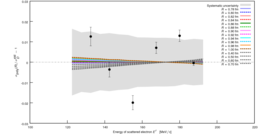
I tried to qualify which of the curves we prefer. Therefore, I constructed the
most-likelihood function. It seems that the data prefer the dipole fit, with
smaller radius.
4.) 
Corrected default analysis of the data
I had again an error in the analysis. The problem was with the normalization of the data, ie,
how to match the data with different beam energies. The first approach was to normalize
the average of each data set to 1. With such normalization we got R=0.85fm. Then I realized that
this is not ok, and thought that the proper way is to match the position of the tail
with the points from the following peak. With this approach I got R=0.88fm. However, now
I believe that this is also not OK. What we should look at is the form-factors not
the cross-sections. There is no reason why the cross-sections should match. On the
other hand FFs need to match. When I do this, I get radius slightly below 0.85 fm
consistent with the value from the Maximum-Likelihood analysis.
5.) 
6.) 
Important Question:
The Jet-ISR aims to measure CS with the same precision as shown above. Are we going
to be sensitive enough to say more about FFs?
Last modified 25.08.2016

 3.)
3.)