Meeting No. 13
Vertex diagram and Adrian's comment:
I was thinking and discussing with Simon the extra vertex correction, that I have built in
and I believe that it is really too much. The argument is, that probability of not emitting
the soft photon is zero and contribution of this diagram to the cross-section also zero.
However, the problem of not canceling the discrepancy remains. Adrian argued, that if vertex
diagram is considered, than we should also consider the leading order term in our simulation.
And actually we do. Our generator throws events according to the exp(delta) correction.
If only delta or exp(delta)-1 then we would have only radiative diagrams. However, here we
have everything. And the same way that leading diagram is in the simulation, also the vertex
diagram is in. Hence, I was double counting!
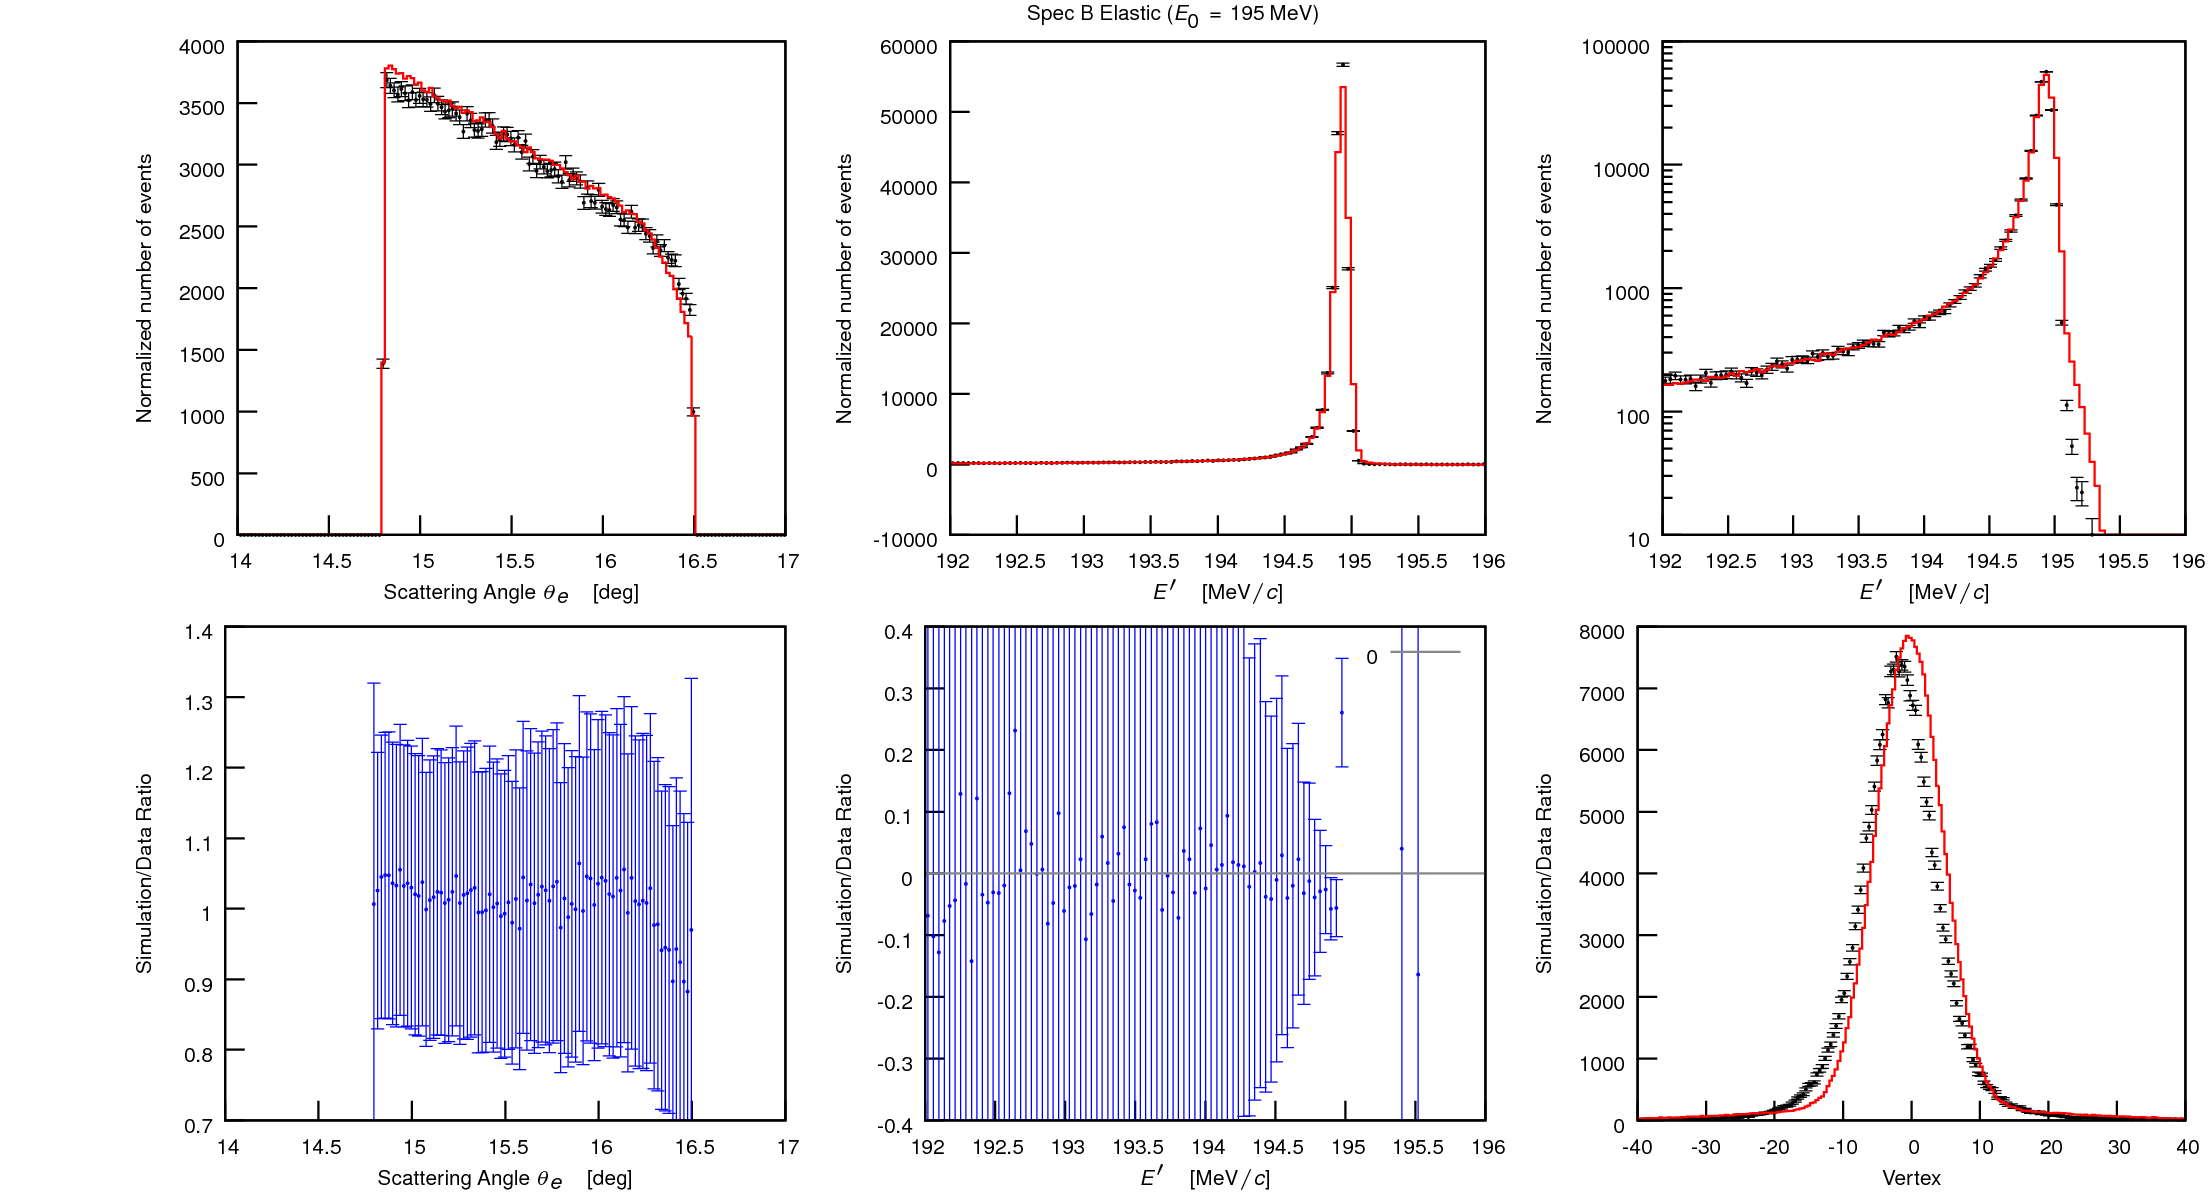
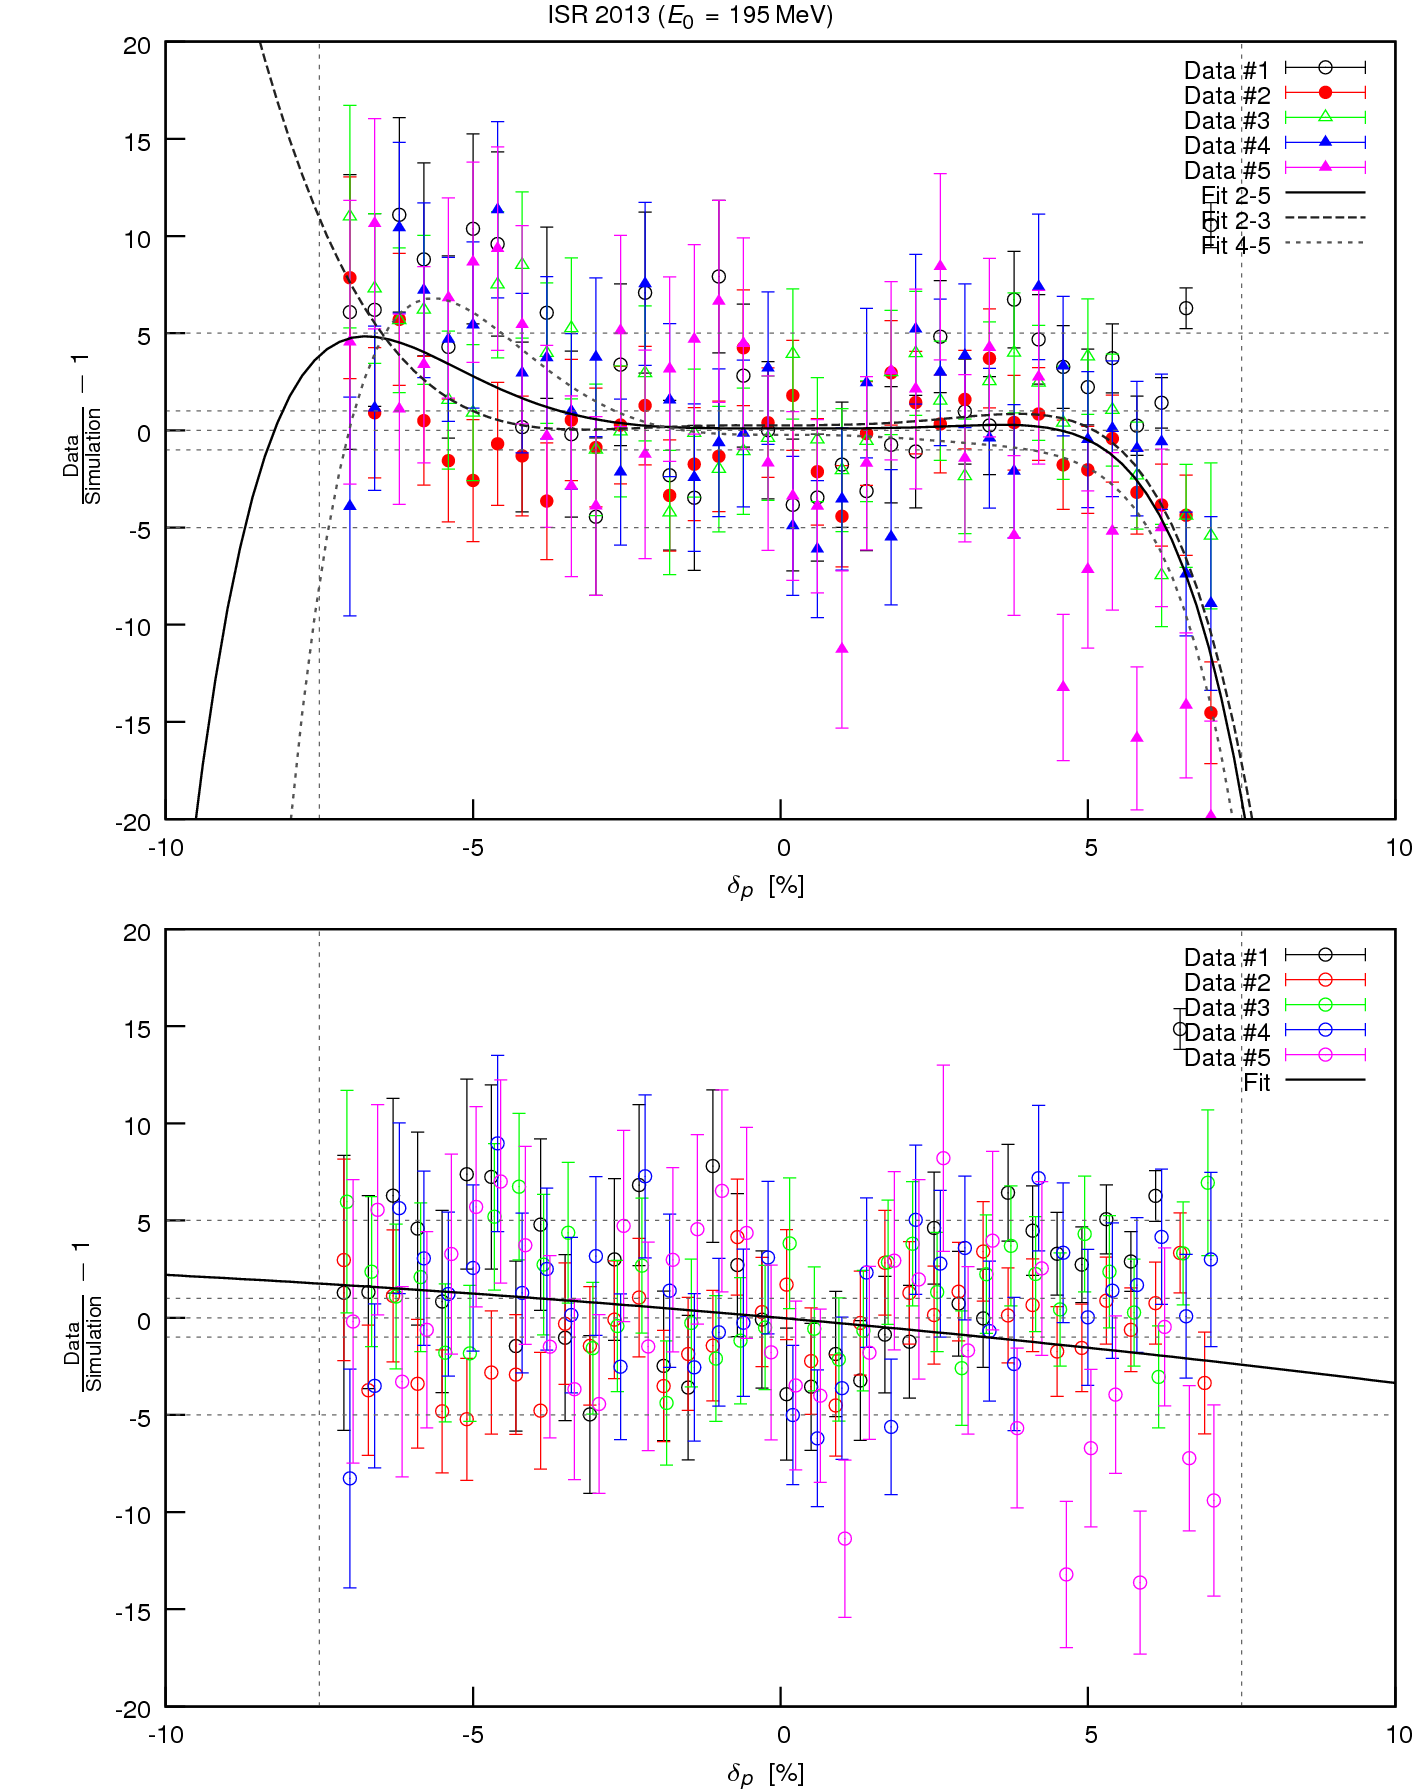
Events missing at the elastic peak:
Our main concern now ot to understand the discrepancy at the elastic line between the data
and the simulation. We see too much simulation. The exactly the same effect is observed by
Jan Friedrich in his thesis. Check his comments regarding the precision of the simulation!
To get a feeling if this is due to the
simulation or due to data I considered the Peak. Approx. simulation and investigated
also spec. A data. I added also the analysis if the carbon data. For spectrometer A
and Carbon data, the discrepancy can not be observed, or we see the opposite problem.
This indicates that the problem is related either to the efficiency at the
center of the spectromter's acceptance or perpahs the vertex cut (optics). Since the simulation
works for A it is hard to understand, why it would not work for B.
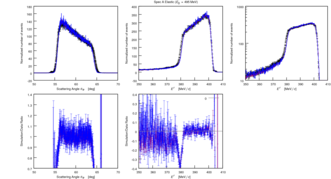
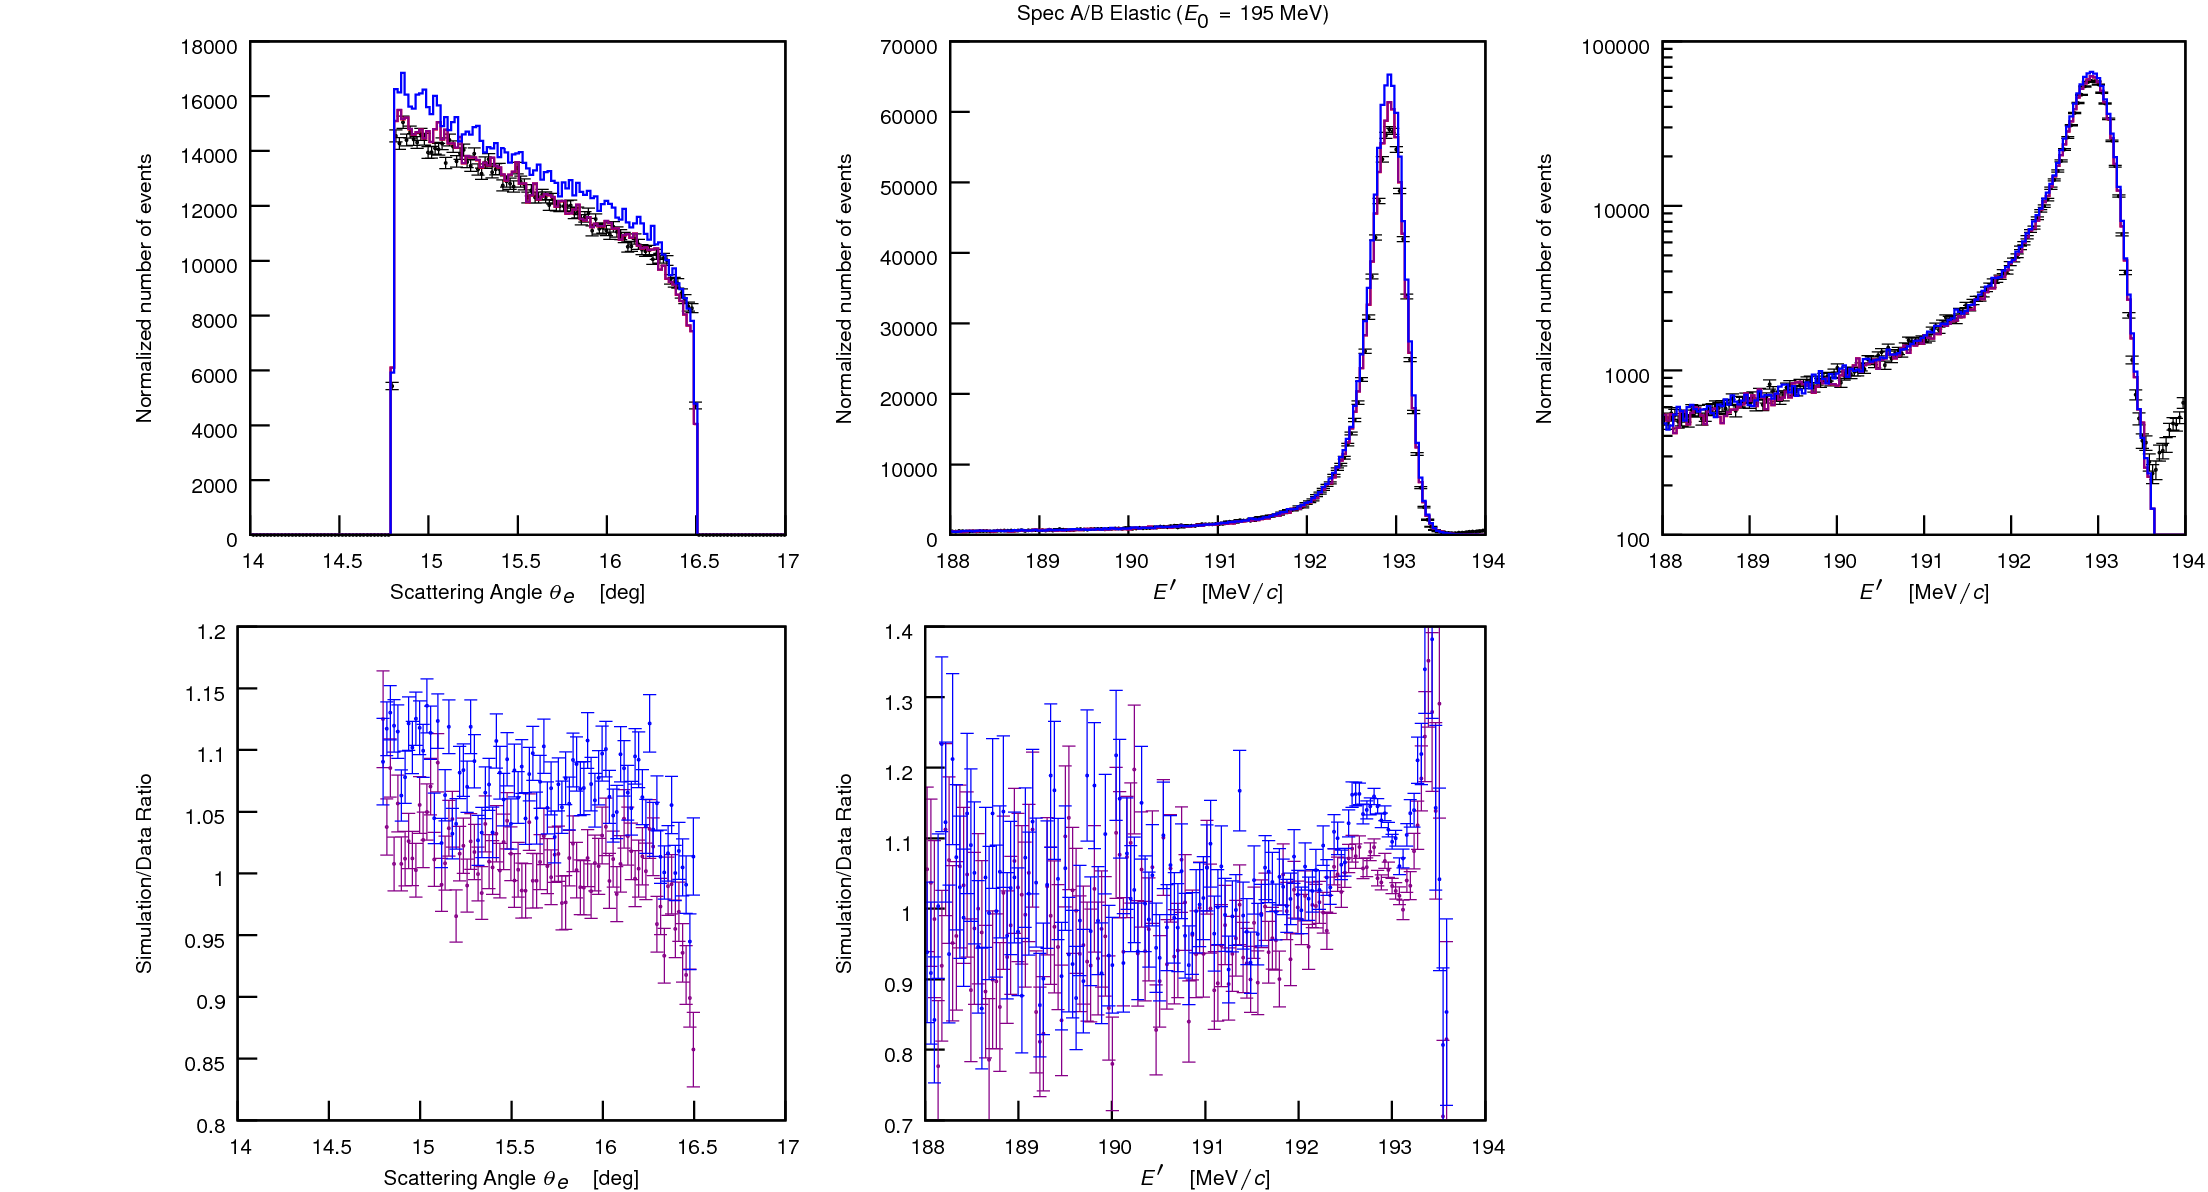
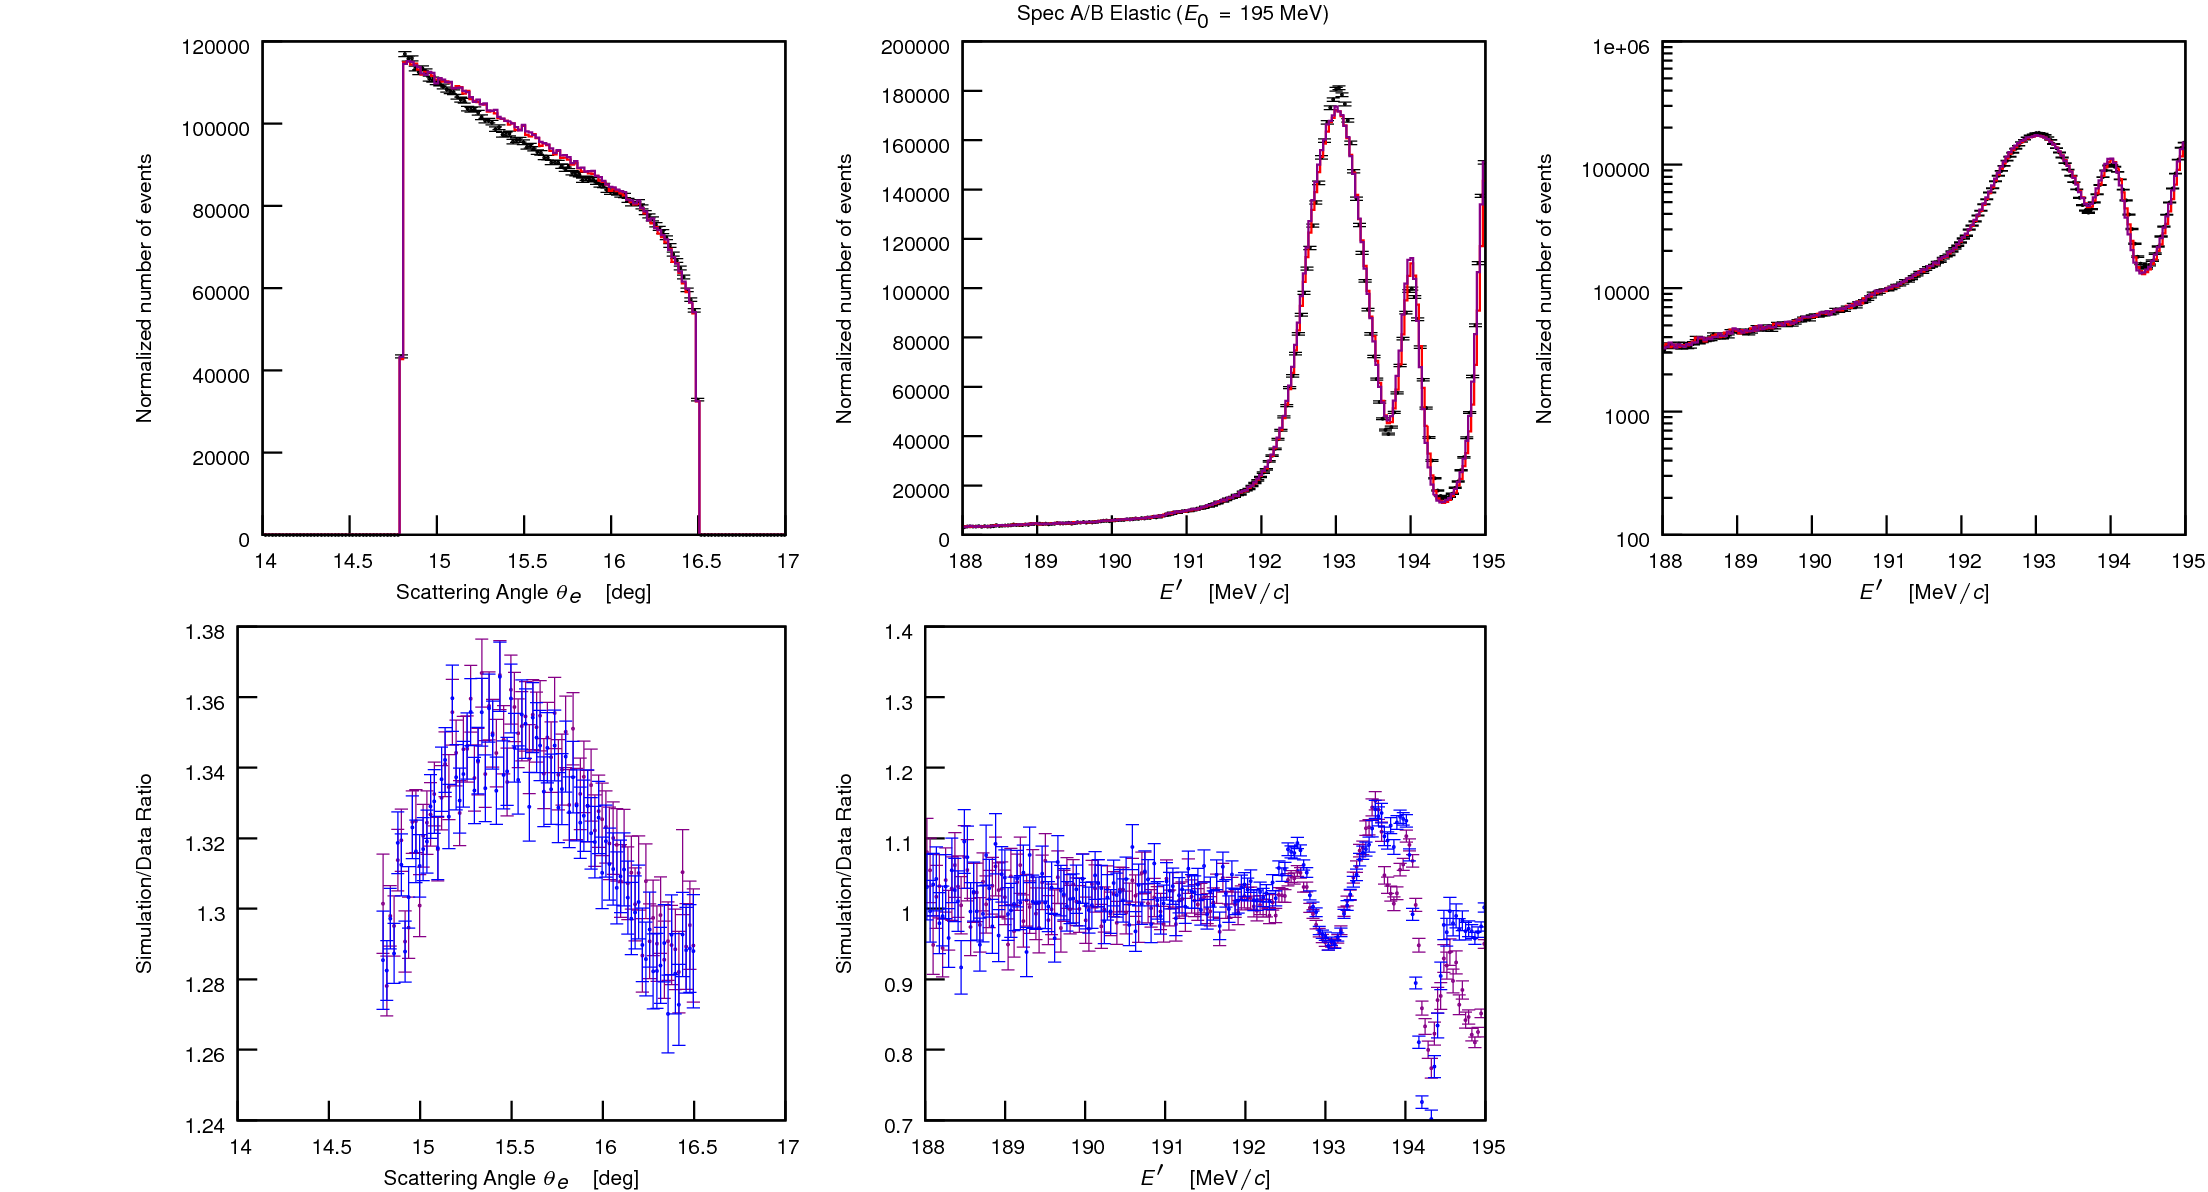
Hydrogen analysis in spec B:
Purple line is the full simulation (with the extra correction at the elastic peak). Blue
is the peaking approximation. The analysis is done such, that simulation is rescaled
such, that full simulation matches data. The PA simulation uses the same normalization.
1.)  2.)
2.) 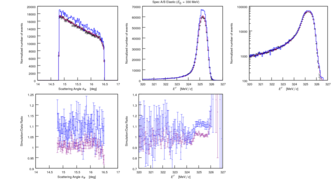 3.)
3.) 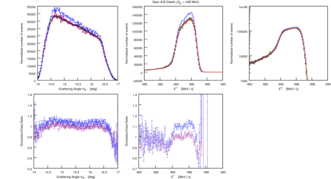
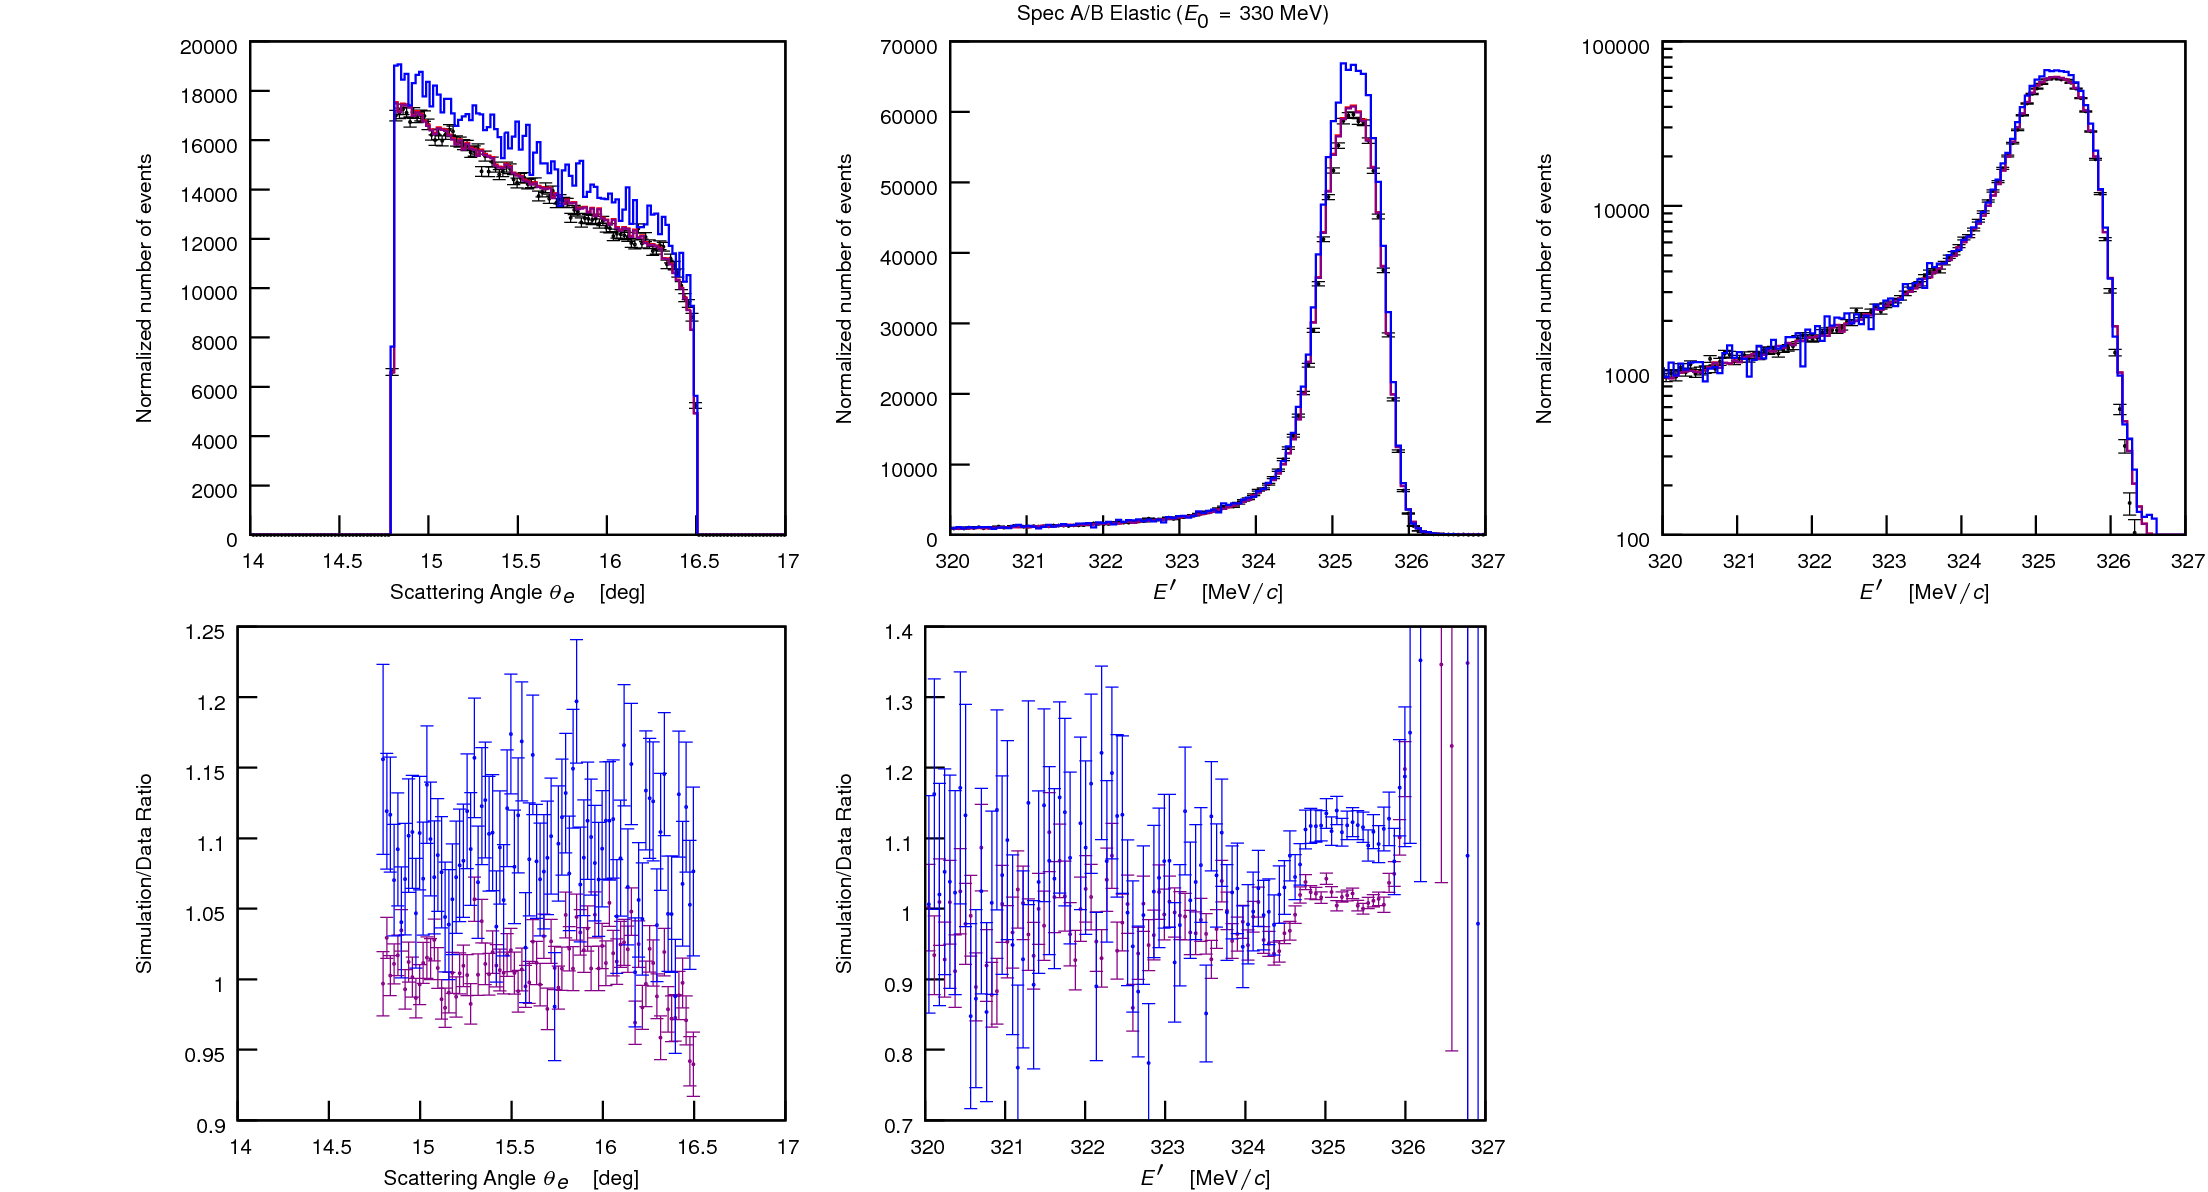
Hydrogen analysis in spec B (without strict vertex cut):
4.) 
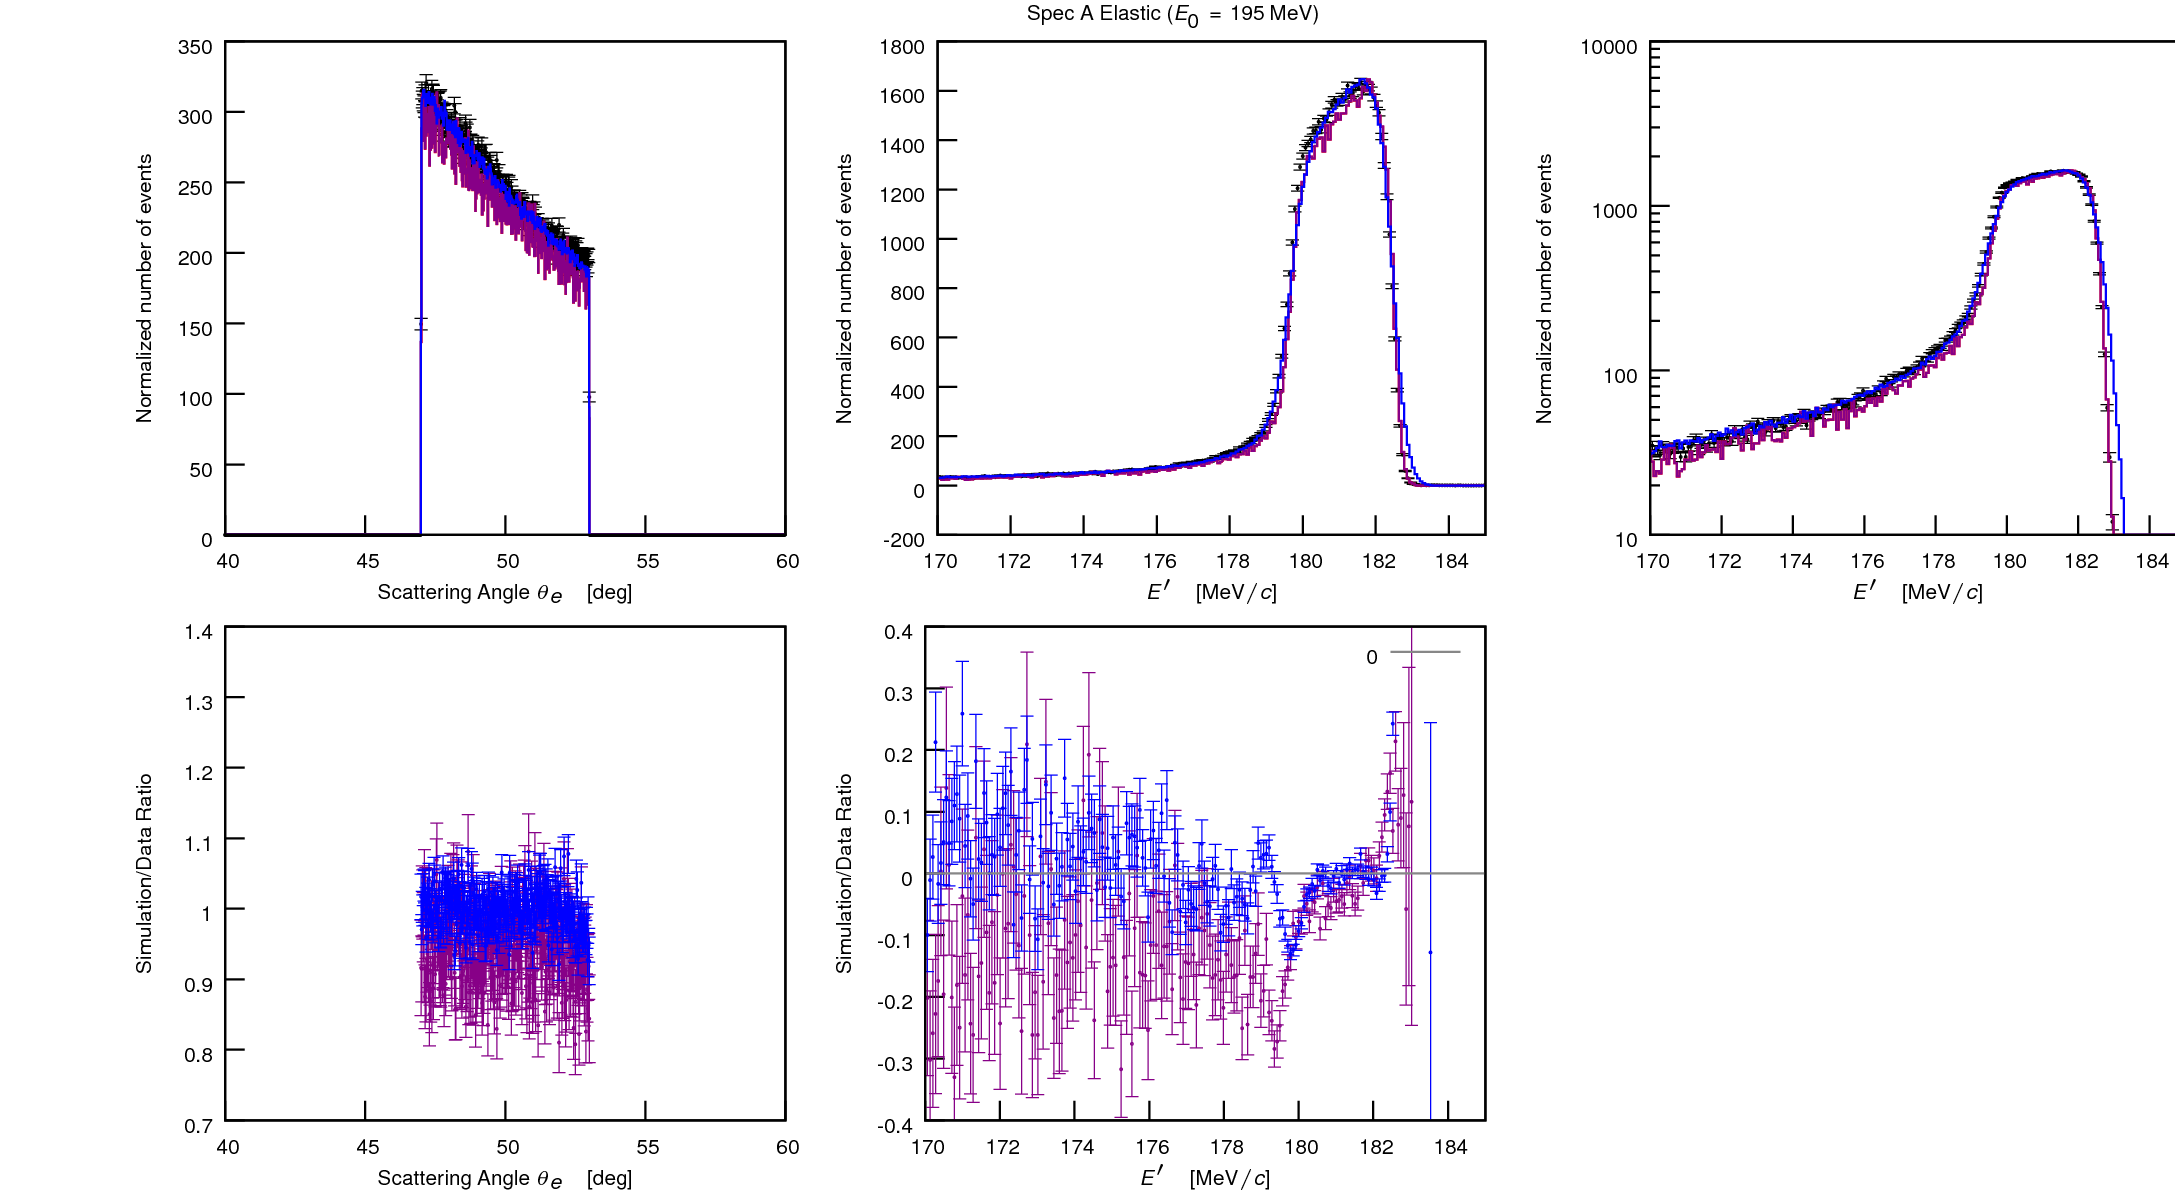
Hydrogen analysis in spec A:
5.) 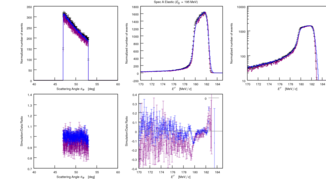 6.)
6.)  7.)
7.) 
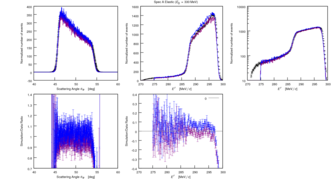
Carbon analysis:
8.)  9.)
9.)  10.)
10.) 
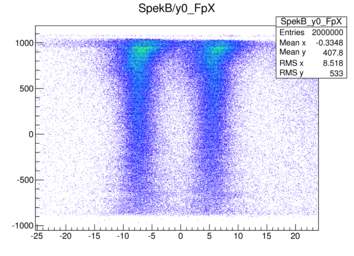
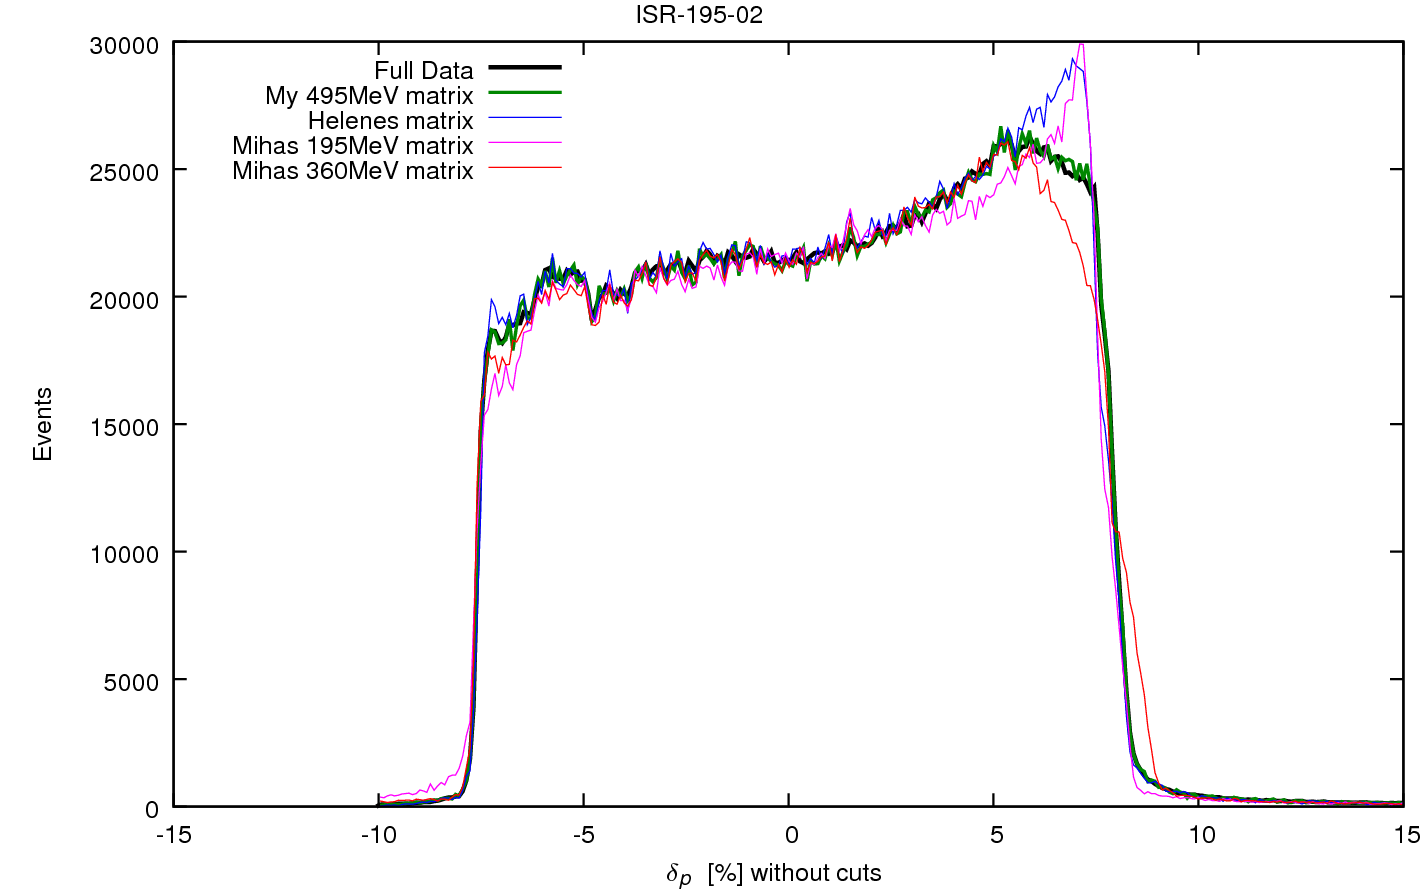
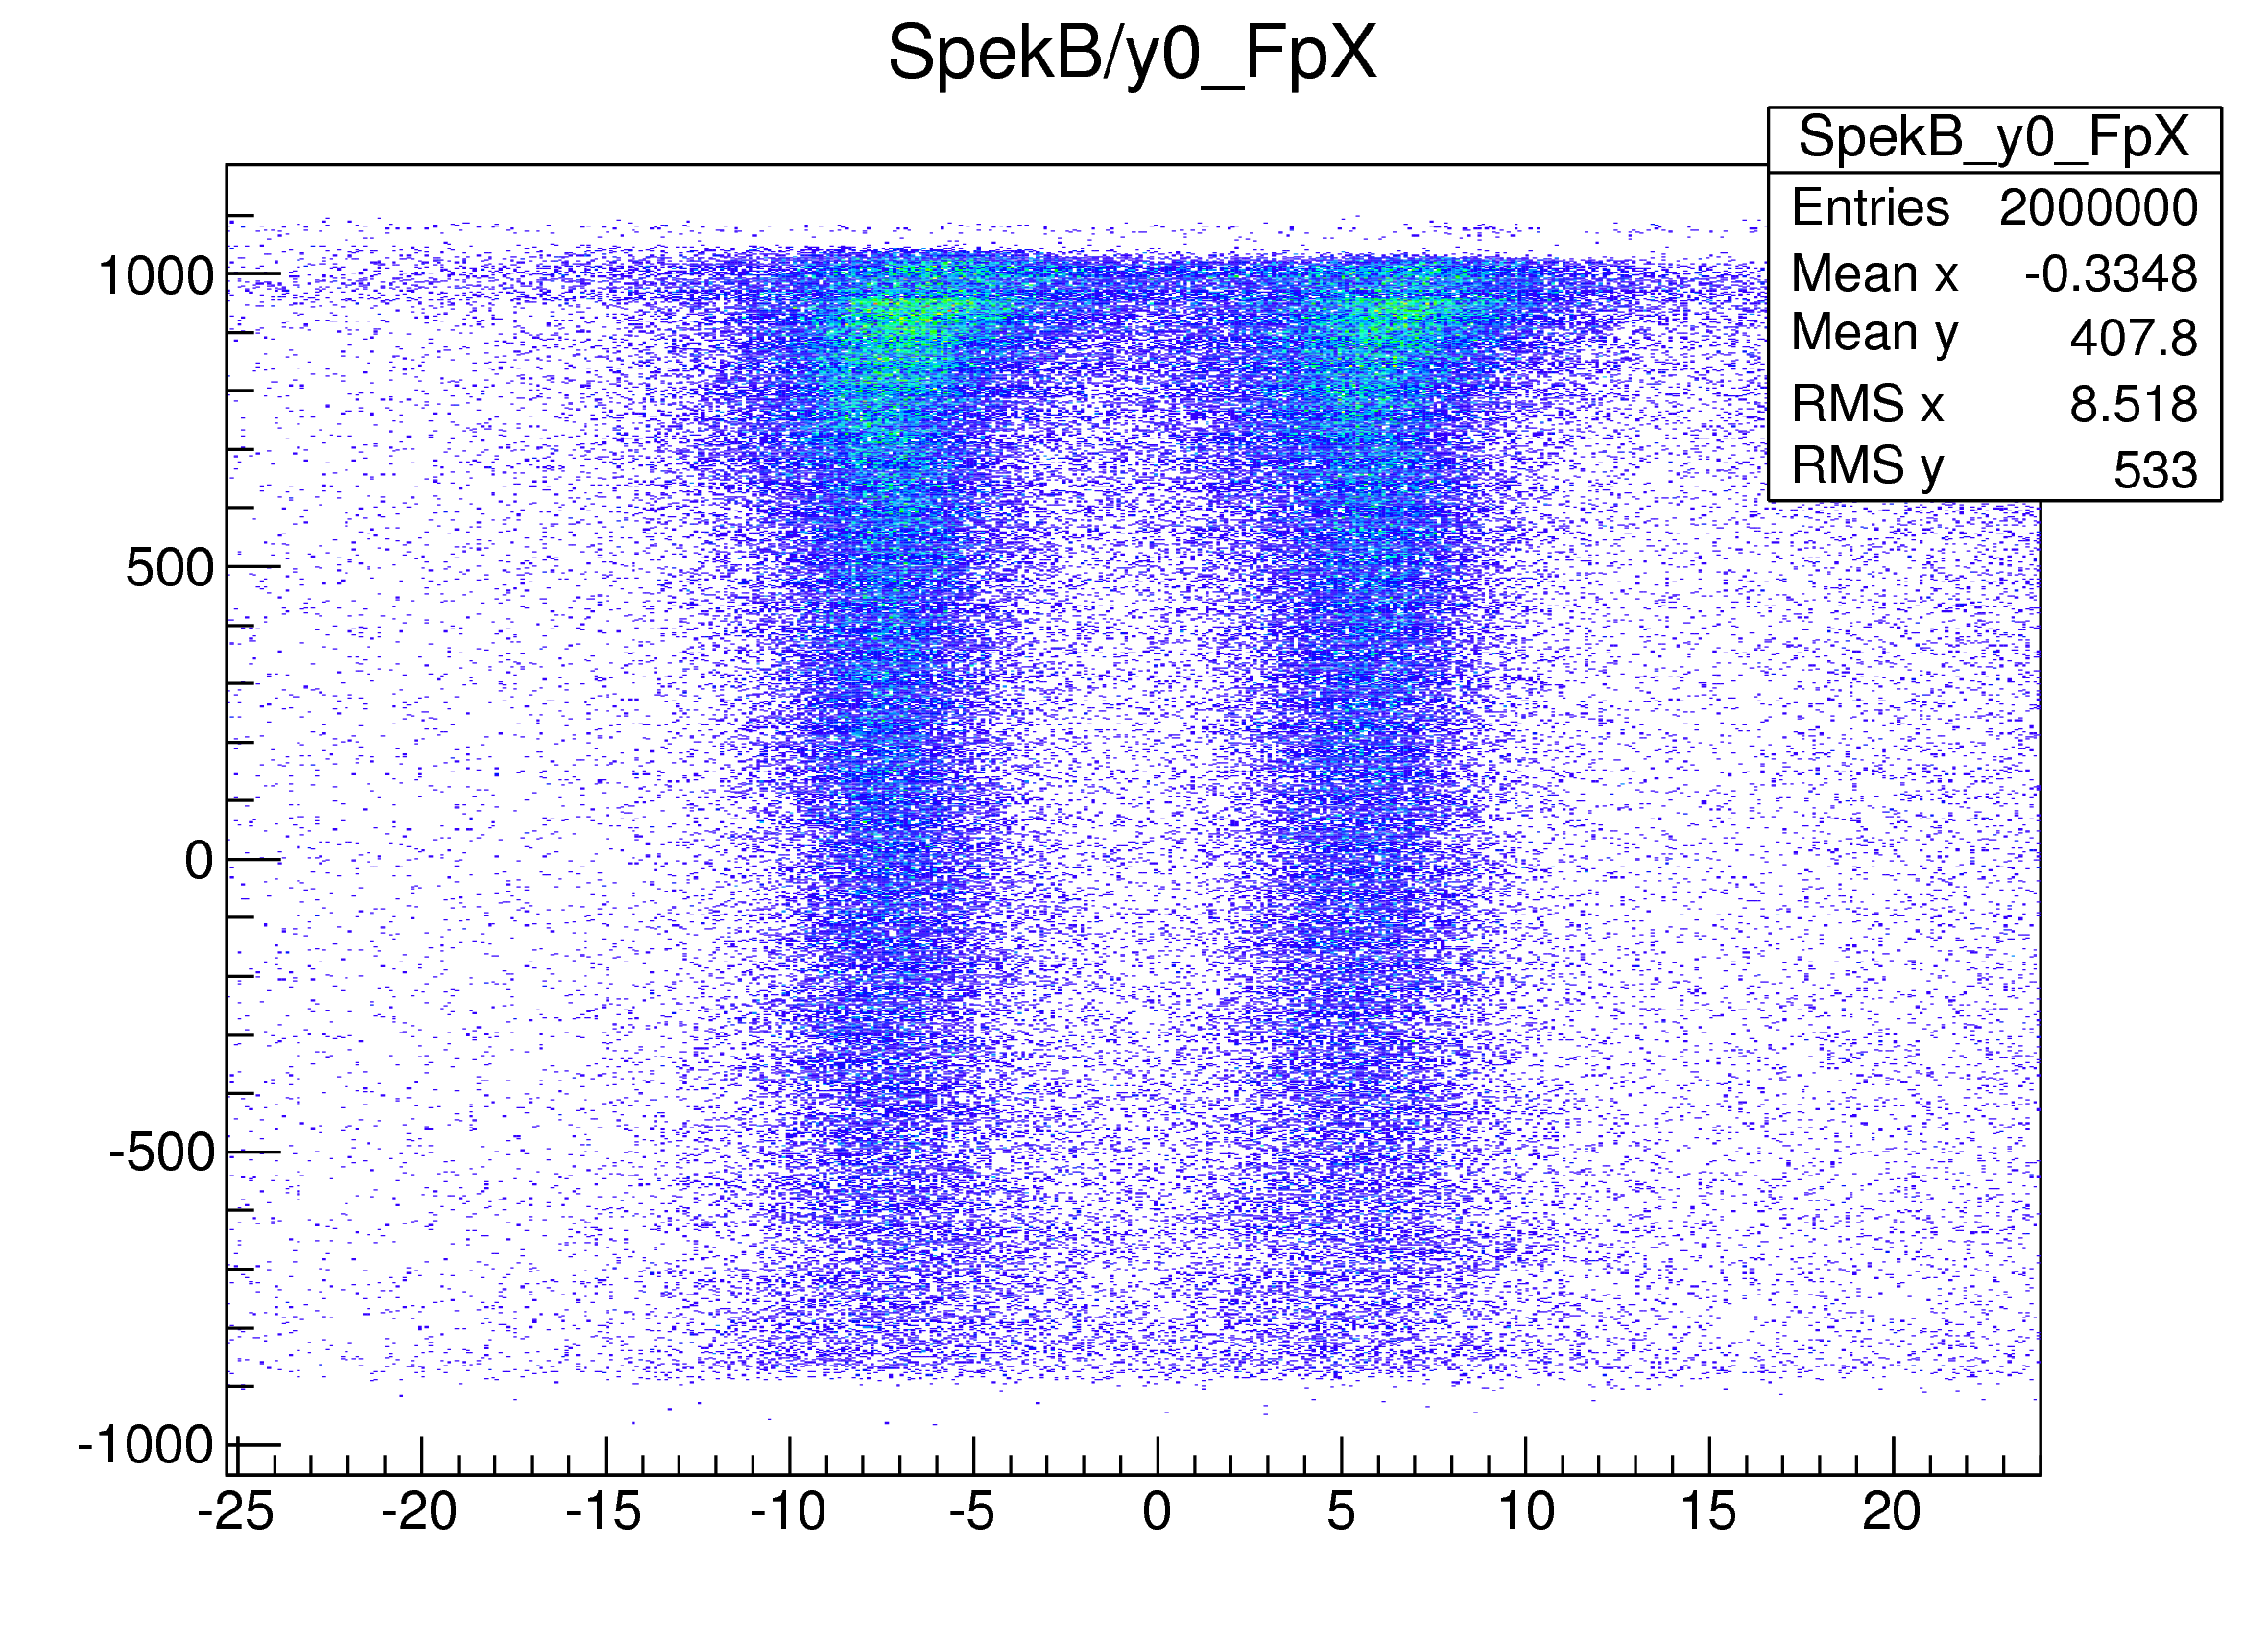
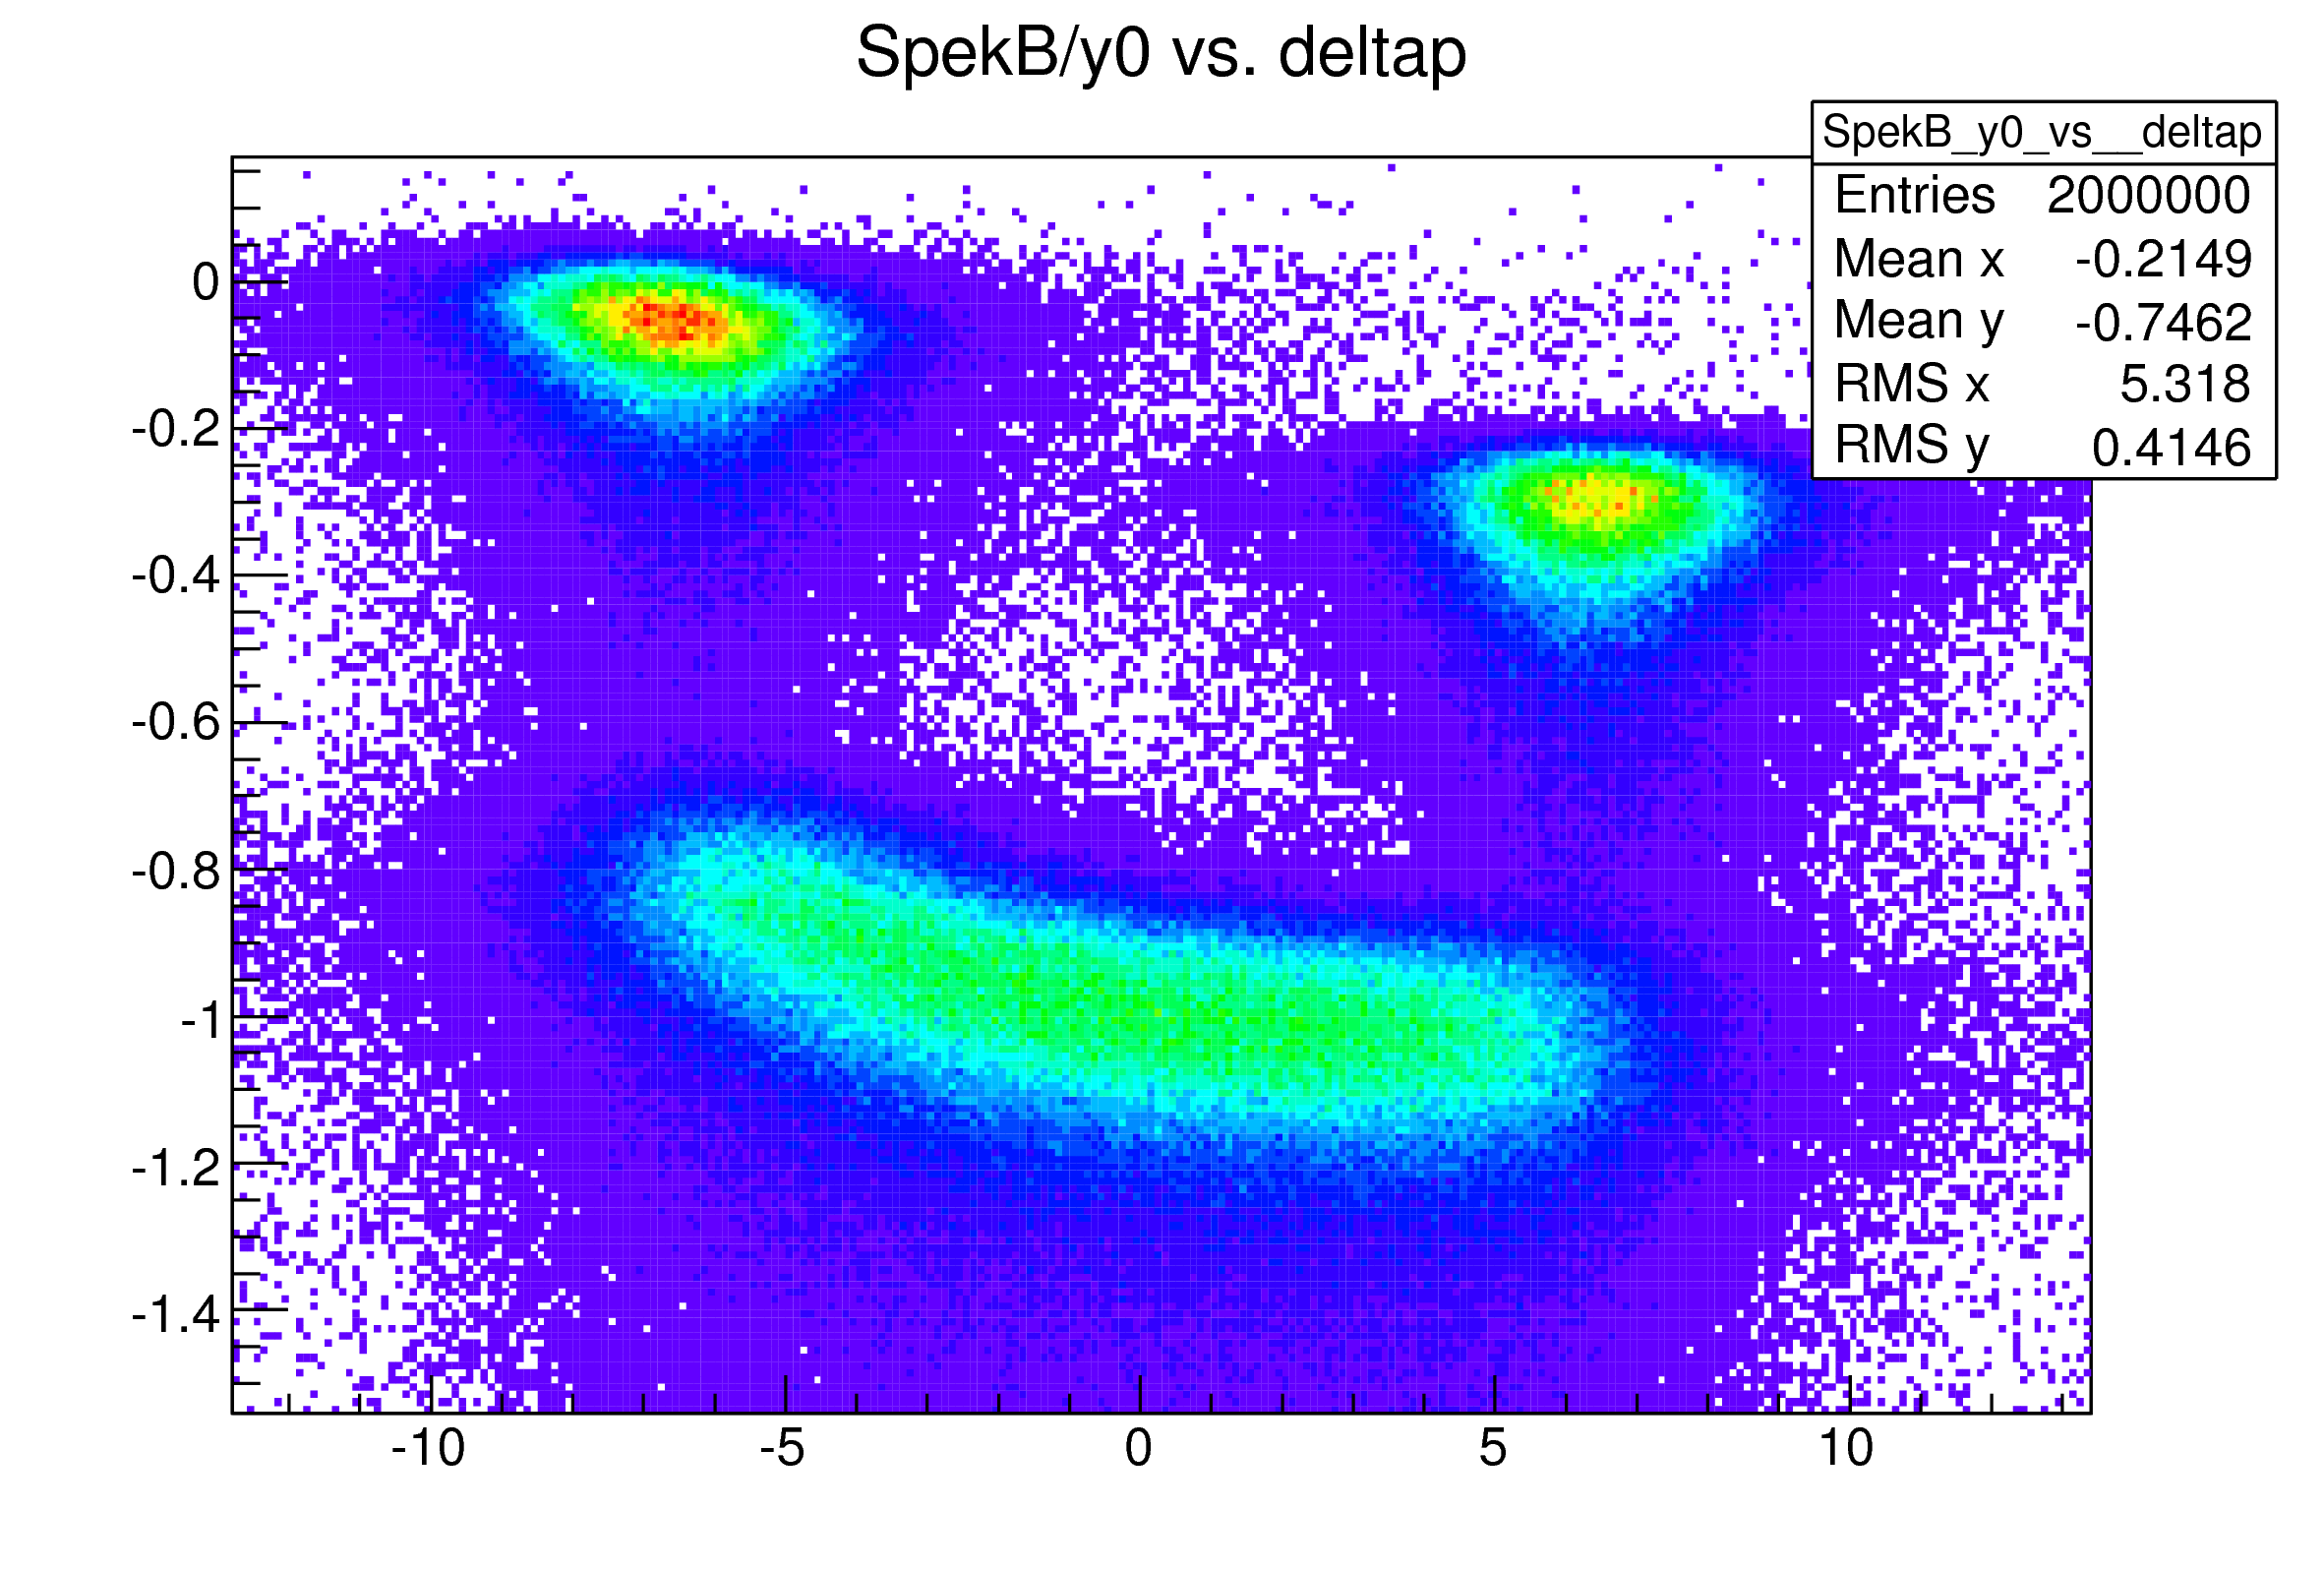
Comparison of different matrices:
I have compared the delta distributions obtained with different matrices. In the
analysis I used standard analysis cuts. The mind boggling thing is the disappearance
of events on the edges. This is due to cut on y0. From the two figures below
one can see, that cut on the middle of acceptance, causes lack of the events
on the edges.
11.) 
12.)  13.)
13.) 
The comparison of the matrices has shown, that matrices have the ability to
cause approx. 10% difference at the elastic peak. However, in my case the
change was in the wrong direction.
14.) 
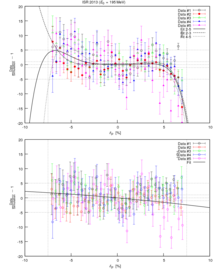
The distribution fluctuation for different matrices with standard cuts:
Helene's matrix @ 634 MeV
15.)  16.)
16.) 
17.)  18.)
18.) 
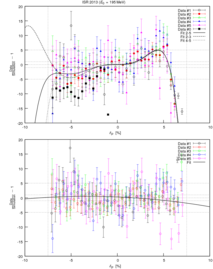
Miha's matrix @ 195 MeV
19.)  20.)
20.) 
21.)  22.)
22.) 
Miha's matrix @ 360 MeV
23.)  24.)
24.) 
Bottom line:
I still can not find the reason for the discrepancy, but it is probably not the simulation!
Last modified 02.06.2016
 3.)
3.) 

 6.)
6.)  7.)
7.) 
 9.)
9.)  10.)
10.) 
 13.)
13.) 
 16.)
16.) 
 18.)
18.) 
 20.)
20.) 
 22.)
22.) 
 24.)
24.) 